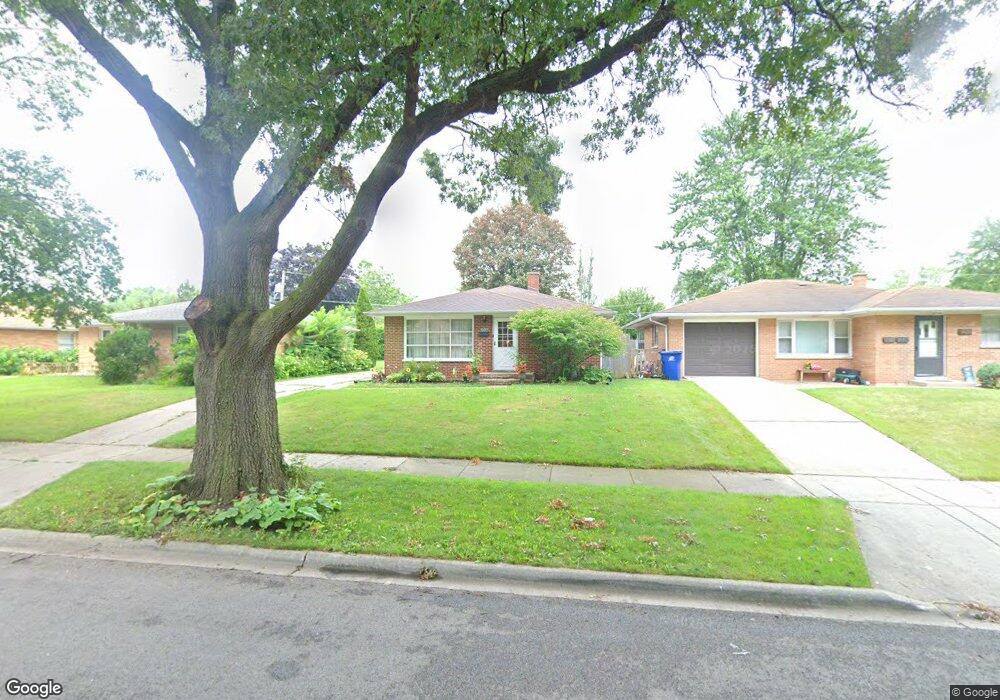
2034 Walnut St Waukegan, IL 60087
Marquette Highlands NeighborhoodEstimated Value: $215,000 - $247,000
2
Beds
1
Bath
1,074
Sq Ft
$217/Sq Ft
Est. Value
About This Home
This home is located at 2034 Walnut St, Waukegan, IL 60087 and is currently estimated at $232,709, approximately $216 per square foot. 2034 Walnut St is a home located in Lake County with nearby schools including Greenwood Elementary School, Edith M Smith Middle School, and Waukegan High School.
Ownership History
Date
Name
Owned For
Owner Type
Purchase Details
Closed on
Mar 18, 2009
Sold by
Garcia Mirna
Bought by
Mendiola Marcelo
Current Estimated Value
Purchase Details
Closed on
Mar 31, 2004
Sold by
Lopez Felipe and Lopez Maria
Bought by
Mendiola Marcelo and Garcia Mirna
Home Financials for this Owner
Home Financials are based on the most recent Mortgage that was taken out on this home.
Original Mortgage
$150,413
Interest Rate
5.66%
Mortgage Type
FHA
Purchase Details
Closed on
Jul 19, 2000
Sold by
Oborny Charles E and The Charles E Oborny Living Tr
Bought by
Lopez Felipe and Lopez Maria
Home Financials for this Owner
Home Financials are based on the most recent Mortgage that was taken out on this home.
Original Mortgage
$116,961
Interest Rate
8.31%
Mortgage Type
FHA
Purchase Details
Closed on
Jun 17, 1998
Sold by
Oborny Charles E
Bought by
Oborny Charles E and Charles E Oborny Living Trust
Create a Home Valuation Report for This Property
The Home Valuation Report is an in-depth analysis detailing your home's value as well as a comparison with similar homes in the area
Home Values in the Area
Average Home Value in this Area
Purchase History
| Date | Buyer | Sale Price | Title Company |
|---|---|---|---|
| Mendiola Marcelo | -- | None Available | |
| Mendiola Marcelo | $153,000 | First American Title Insuran | |
| Lopez Felipe | $118,500 | -- | |
| Oborny Charles E | -- | -- |
Source: Public Records
Mortgage History
| Date | Status | Borrower | Loan Amount |
|---|---|---|---|
| Previous Owner | Mendiola Marcelo | $150,413 | |
| Previous Owner | Lopez Felipe | $116,961 | |
| Closed | Lopez Felipe | $3,000 |
Source: Public Records
Tax History Compared to Growth
Tax History
| Year | Tax Paid | Tax Assessment Tax Assessment Total Assessment is a certain percentage of the fair market value that is determined by local assessors to be the total taxable value of land and additions on the property. | Land | Improvement |
|---|---|---|---|---|
| 2024 | $4,229 | $58,572 | $10,932 | $47,640 |
| 2023 | $4,122 | $52,852 | $9,864 | $42,988 |
| 2022 | $4,122 | $48,164 | $8,537 | $39,627 |
| 2021 | $3,880 | $43,213 | $7,617 | $35,596 |
| 2020 | $3,883 | $40,258 | $7,096 | $33,162 |
| 2019 | $3,856 | $36,890 | $6,502 | $30,388 |
| 2018 | $3,549 | $33,830 | $9,203 | $24,627 |
| 2017 | $3,404 | $29,930 | $8,142 | $21,788 |
| 2016 | $3,092 | $26,008 | $7,075 | $18,933 |
| 2015 | $2,918 | $23,277 | $6,332 | $16,945 |
| 2014 | $2,785 | $21,997 | $6,069 | $15,928 |
| 2012 | $3,671 | $23,833 | $6,576 | $17,257 |
Source: Public Records
Map
Nearby Homes
- 1905 Linden Ave
- 2232 Walnut St
- 616 W Keith Ave
- 1018 W Atlantic Ave
- 301 W Eagle Ct
- 1335 Chestnut St
- 1336 N Ash St
- 0 Traditions Dr
- 2350 N Lewis Ave
- 1312 N Linden Ave
- 2246 Alta Vista Dr
- 2213 Alta Vista Dr
- 1504 W Glen Flora Ave
- 1105 Woodlawn Cir
- 2613 N Lewis Ave
- 2008 Harding Ave
- 2207 Williamsburg Dr
- 1612 Whitney St
- 2009 Harding Ave
- 1110 N Ash St
- 2038 Walnut St
- 2030 Walnut St
- 2026 Walnut St
- 2042 Walnut St
- 2033 Linden Ave
- 2037 Linden Ave
- 2029 Linden Ave
- 2022 Walnut St
- 2046 Walnut St
- 2035 Walnut St
- 2031 Walnut St
- 2021 Linden Ave
- 2045 Linden Ave
- 2041 Walnut St
- 2018 Walnut St
- 2050 Walnut St
- 2027 Walnut St
- 2045 Walnut St
- 2017 Linden Ave
- 2049 Linden Ave