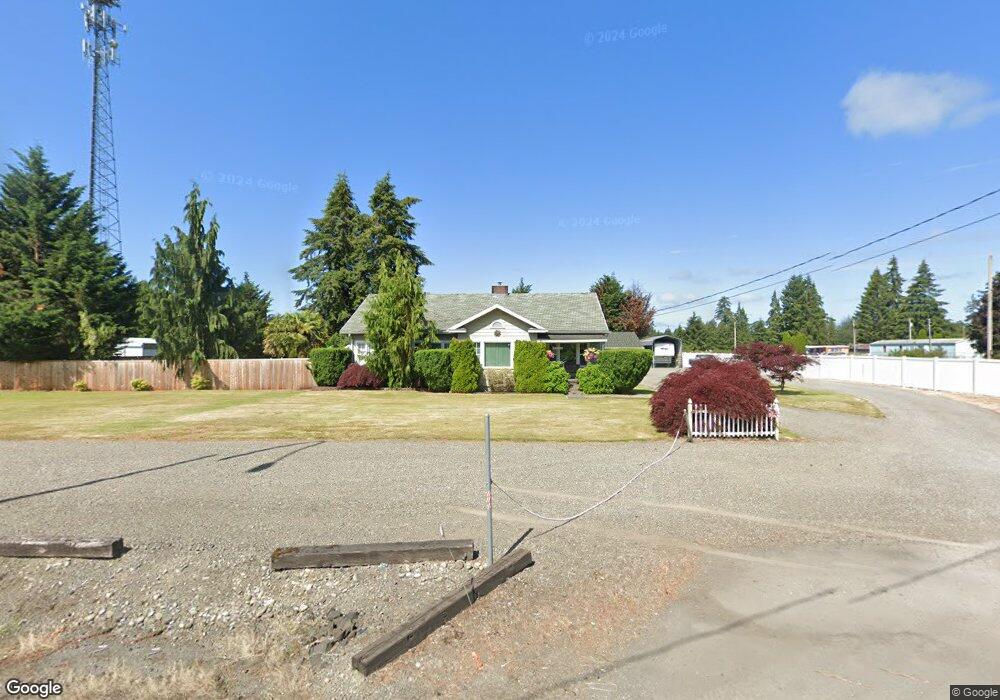
20341 Old Highway 99 SW Centralia, WA 98531
Grand Mound NeighborhoodEstimated Value: $349,000 - $504,000
2
Beds
2
Baths
1,970
Sq Ft
$226/Sq Ft
Est. Value
About This Home
This home is located at 20341 Old Highway 99 SW, Centralia, WA 98531 and is currently estimated at $445,846, approximately $226 per square foot. 20341 Old Highway 99 SW is a home located in Thurston County with nearby schools including Rochester Primary School, Grand Mound Elementary School, and Rochester Middle School.
Ownership History
Date
Name
Owned For
Owner Type
Purchase Details
Closed on
Mar 14, 2005
Sold by
Peterson Pamela S and Bushell Pamela S
Bought by
Peterson Dennis W and Peterson Pamela S
Current Estimated Value
Home Financials for this Owner
Home Financials are based on the most recent Mortgage that was taken out on this home.
Original Mortgage
$74,500
Outstanding Balance
$37,770
Interest Rate
5.61%
Mortgage Type
New Conventional
Estimated Equity
$408,076
Purchase Details
Closed on
Feb 15, 2002
Sold by
Hughley Helen A
Bought by
Bushell Pamela S
Purchase Details
Closed on
Dec 14, 1998
Sold by
Sunia Sheryl Ann
Bought by
Bushell Pamela S
Purchase Details
Closed on
Jul 10, 1996
Sold by
Sunia Sheryl Ann and Hughey James H
Bought by
Sunia Sheryl Ann and Bushell Pamela S
Create a Home Valuation Report for This Property
The Home Valuation Report is an in-depth analysis detailing your home's value as well as a comparison with similar homes in the area
Home Values in the Area
Average Home Value in this Area
Purchase History
| Date | Buyer | Sale Price | Title Company |
|---|---|---|---|
| Peterson Dennis W | -- | Pioneer Title Company | |
| Bushell Pamela S | -- | Transnation Title Insurance | |
| Bushell Pamela S | $25,000 | First American Title Ins Co | |
| Bushell Pamela S | $50,000 | First American Title Ins Co | |
| Sunia Sheryl Ann | -- | -- |
Source: Public Records
Mortgage History
| Date | Status | Borrower | Loan Amount |
|---|---|---|---|
| Open | Peterson Dennis W | $74,500 |
Source: Public Records
Tax History Compared to Growth
Tax History
| Year | Tax Paid | Tax Assessment Tax Assessment Total Assessment is a certain percentage of the fair market value that is determined by local assessors to be the total taxable value of land and additions on the property. | Land | Improvement |
|---|---|---|---|---|
| 2024 | $2,824 | $346,500 | $139,400 | $207,100 |
| 2023 | $2,824 | $324,500 | $108,100 | $216,400 |
| 2022 | $2,902 | $299,800 | $74,000 | $225,800 |
| 2021 | $2,474 | $281,600 | $96,400 | $185,200 |
| 2020 | $2,604 | $220,000 | $63,200 | $156,800 |
| 2019 | $2,355 | $193,000 | $52,400 | $140,600 |
| 2018 | $2,603 | $181,400 | $46,600 | $134,800 |
| 2017 | $2,285 | $160,400 | $46,200 | $114,200 |
| 2016 | $2,032 | $151,650 | $47,750 | $103,900 |
| 2014 | -- | $139,550 | $47,750 | $91,800 |
Source: Public Records
Map
Nearby Homes
- 20333 Old Highway 99 SW
- 6201 203rd Ave SW Unit 14
- 6511 203rd Ave SW
- 6411 201st Ave SW Unit 21
- 6521 201st Ave SW
- 20000 Kuper Ct
- 0 Hwy 12 SW Unit NWM2363119
- 19838 Bear View Ln SW
- 19714 Aspenwood Ct SW
- 20102 Rainy Ln SW
- 7140 196th Ave SW
- 19140 Rosemary St SW
- 19139 Rosemary St SW
- 7140 191st Ave SW Unit 26
- 19106 Nutmeg St SW
- 20005 Carper Rd SW
- 5916 187th Ln SW
- 6123 186th Trail SW
- 8045 Prather Rd SW
- 3718 Harrison Ave
- 20347 Old Highway 99 SW
- 20327 Old Highway 99 SW
- 20333 Old Highway 99 SW
- 6201 203rd Ave SW Unit 4
- 6201 203rd Ave SW Unit 16
- 6201 203rd Ave SW Unit 5
- 2237 Old Highway 99 SW
- 20548 Grand Mound Way SW
- 6215 203rd Ave SW
- 6130 203rd Ave SW
- 20248 White Rock Loop SW
- 20249 White Rock Loop SW
- 20244 White Rock Loop SW
- 20245 White Rock Lp SW
- 20245 White Rock Loop SW
- 20200 White Rock Loop SW
- 20448 Grand Mound Way SW
- 20238 Old Highway 99 SW
- 20546 Grand Mound Way SW