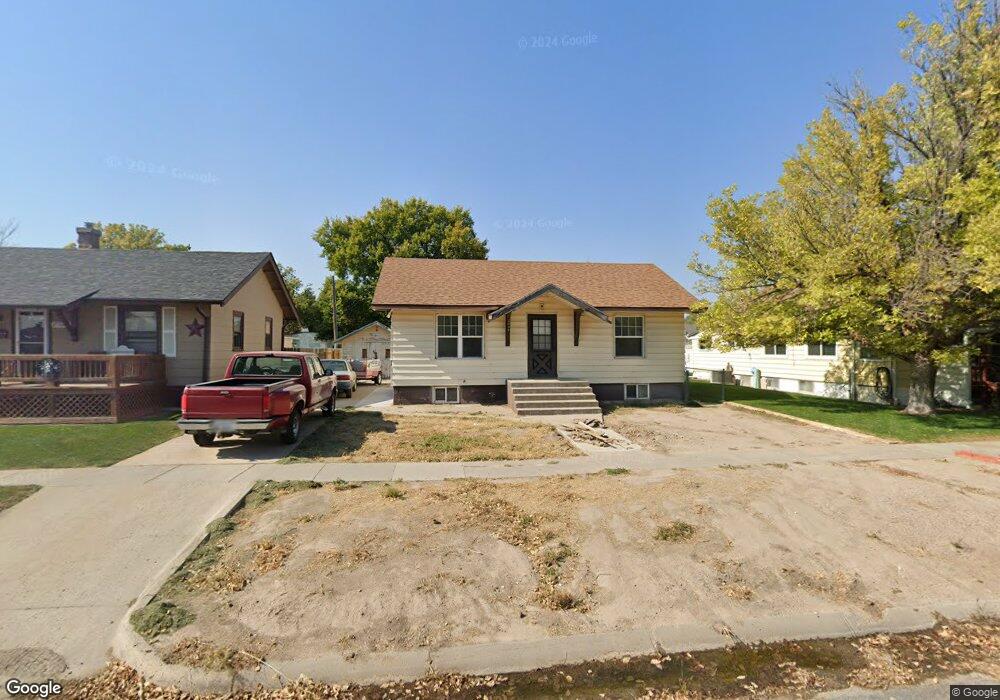
2035 11th St Gering, NE 69341
Estimated Value: $132,000 - $161,000
2
Beds
1
Bath
768
Sq Ft
$190/Sq Ft
Est. Value
About This Home
This home is located at 2035 11th St, Gering, NE 69341 and is currently estimated at $145,826, approximately $189 per square foot. 2035 11th St is a home located in Scotts Bluff County with nearby schools including Gering High School and Community Christian Elementary/Middle School.
Ownership History
Date
Name
Owned For
Owner Type
Purchase Details
Closed on
Feb 25, 2013
Sold by
Household Finance Corporation Iii
Bought by
Wiegel David
Current Estimated Value
Home Financials for this Owner
Home Financials are based on the most recent Mortgage that was taken out on this home.
Original Mortgage
$50,000
Outstanding Balance
$34,966
Interest Rate
3.57%
Mortgage Type
Future Advance Clause Open End Mortgage
Estimated Equity
$110,860
Purchase Details
Closed on
Jan 27, 2010
Sold by
Wells Fargo Bank Na
Bought by
Wiegel David F
Purchase Details
Closed on
Jan 12, 2009
Sold by
Ramirez Andy and Ramirez Shelley A
Bought by
Wells Fargo Bank Na
Create a Home Valuation Report for This Property
The Home Valuation Report is an in-depth analysis detailing your home's value as well as a comparison with similar homes in the area
Home Values in the Area
Average Home Value in this Area
Purchase History
| Date | Buyer | Sale Price | Title Company |
|---|---|---|---|
| Wiegel David | $16,000 | First American Title | |
| Wiegel David F | $35,000 | -- | |
| Wells Fargo Bank Na | $67,500 | -- |
Source: Public Records
Mortgage History
| Date | Status | Borrower | Loan Amount |
|---|---|---|---|
| Open | Wiegel David | $50,000 |
Source: Public Records
Tax History
| Year | Tax Paid | Tax Assessment Tax Assessment Total Assessment is a certain percentage of the fair market value that is determined by local assessors to be the total taxable value of land and additions on the property. | Land | Improvement |
|---|---|---|---|---|
| 2025 | $1,915 | $113,840 | $17,500 | $96,340 |
| 2024 | $1,850 | $105,080 | $17,500 | $87,580 |
| 2023 | $1,525 | $71,176 | $4,200 | $66,976 |
| 2022 | $1,525 | $71,176 | $4,200 | $66,976 |
| 2021 | $1,447 | $66,794 | $4,200 | $62,594 |
| 2020 | $1,391 | $63,813 | $4,200 | $59,613 |
| 2019 | $1,357 | $63,813 | $4,200 | $59,613 |
| 2018 | $1,365 | $63,813 | $4,200 | $59,613 |
| 2017 | $1,306 | $60,974 | $4,200 | $56,774 |
| 2016 | $1,213 | $60,974 | $4,200 | $56,774 |
| 2015 | $1,176 | $59,320 | $4,200 | $55,120 |
| 2014 | $728 | $36,236 | $4,200 | $32,036 |
| 2012 | -- | $35,608 | $4,200 | $31,408 |
Source: Public Records
Map
Nearby Homes
Your Personal Tour Guide
Ask me questions while you tour the home.