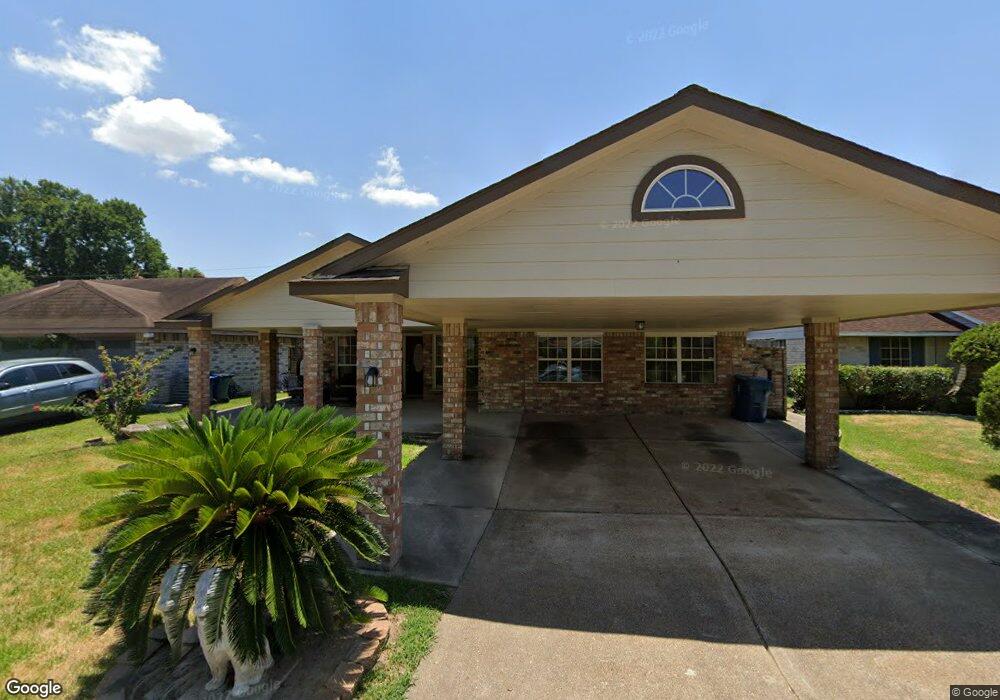
2035 Bunzel St Houston, TX 77088
Acres Homes NeighborhoodEstimated Value: $197,927 - $219,000
3
Beds
1
Bath
1,415
Sq Ft
$149/Sq Ft
Est. Value
About This Home
This home is located at 2035 Bunzel St, Houston, TX 77088 and is currently estimated at $210,482, approximately $148 per square foot. 2035 Bunzel St is a home located in Harris County with nearby schools including Hill Intermediate School, Stovall School, and Dr. Viola K. Garcia Middle School.
Ownership History
Date
Name
Owned For
Owner Type
Purchase Details
Closed on
May 3, 2019
Sold by
Loandepot Com Llc
Bought by
Venegas Luis Carlos and Venegas Maria Elizabeth
Current Estimated Value
Purchase Details
Closed on
Jan 24, 2019
Sold by
Cruz Katherine J and Escobar Saul A Larios
Bought by
Loandepot Com Llc
Purchase Details
Closed on
Jan 31, 2017
Sold by
Invum Two Llc
Bought by
Cruz Oswald S and Cruz Katherine J
Home Financials for this Owner
Home Financials are based on the most recent Mortgage that was taken out on this home.
Original Mortgage
$120,772
Interest Rate
4.75%
Mortgage Type
FHA
Purchase Details
Closed on
Jun 22, 2016
Sold by
Ramirez Israel and Ramirez Leonor
Bought by
Invum Two Llc
Purchase Details
Closed on
Jul 6, 1995
Sold by
Ritcheson Donald Ray
Bought by
Ramirez Israel and Ramirez Leonor
Home Financials for this Owner
Home Financials are based on the most recent Mortgage that was taken out on this home.
Original Mortgage
$38,800
Interest Rate
7.65%
Create a Home Valuation Report for This Property
The Home Valuation Report is an in-depth analysis detailing your home's value as well as a comparison with similar homes in the area
Home Values in the Area
Average Home Value in this Area
Purchase History
| Date | Buyer | Sale Price | Title Company |
|---|---|---|---|
| Venegas Luis Carlos | $1,024,000 | Solidifi | |
| Loandepot Com Llc | $98,400 | None Available | |
| Cruz Oswald S | -- | None Available | |
| Invum Two Llc | $80,001 | None Available | |
| Ramirez Israel | -- | First American Title |
Source: Public Records
Mortgage History
| Date | Status | Borrower | Loan Amount |
|---|---|---|---|
| Previous Owner | Cruz Oswald S | $120,772 | |
| Previous Owner | Ramirez Israel | $38,800 |
Source: Public Records
Tax History Compared to Growth
Tax History
| Year | Tax Paid | Tax Assessment Tax Assessment Total Assessment is a certain percentage of the fair market value that is determined by local assessors to be the total taxable value of land and additions on the property. | Land | Improvement |
|---|---|---|---|---|
| 2025 | $3,977 | $205,533 | $44,661 | $160,872 |
| 2024 | $3,977 | $205,533 | $44,661 | $160,872 |
| 2023 | $3,977 | $205,533 | $44,661 | $160,872 |
| 2022 | $3,455 | $168,020 | $35,729 | $132,291 |
| 2021 | $2,952 | $136,953 | $35,729 | $101,224 |
| 2020 | $3,188 | $140,350 | $14,292 | $126,058 |
| 2019 | $3,000 | $126,121 | $14,292 | $111,829 |
| 2018 | $1,655 | $115,263 | $14,292 | $100,971 |
| 2017 | $2,612 | $115,263 | $14,292 | $100,971 |
| 2016 | $2,117 | $107,602 | $14,292 | $93,310 |
| 2015 | $1,425 | $96,859 | $14,292 | $82,567 |
| 2014 | $1,425 | $77,200 | $14,292 | $62,908 |
Source: Public Records
Map
Nearby Homes
- 1907 Bunzel St
- 2146 Twinbrooke Dr
- 2110 Mosher Ln
- 2214 Twinbrooke Dr
- 1806 Saddle Rock Dr Unit 770
- 2211 Mosher Ln
- 2003 Deerhurst Ln
- 8835 Glenhouse Dr
- 9722 Willow
- 1710 Beaver Bend Rd
- 1707 Winter Bay Ln
- 1615 Mosher Ln
- 2323 Hampton St
- 2200 Hampton St
- 1918 Hampton St
- 10642 Logger Pine Trail Unit B
- 10634 Logger Pine Trail
- 9208 Ab Wheatley St
- 9206 Ab Wheatley St
- 2418 Fallen Pine Ln
- 2031 Bunzel St
- 2039 Bunzel St
- 2034 Rainy River Dr
- 2027 Bunzel St
- 2030 Rainy River Dr
- 2038 Rainy River Dr
- 2026 Rainy River Dr
- 2034 Bunzel St
- 2023 Bunzel St
- 2030 Bunzel St
- 2038 Bunzel St
- 2103 Bunzel St
- 2026 Bunzel St
- 2022 Rainy River Dr
- 2102 Rainy River Dr
- 2019 Bunzel St
- 2022 Bunzel St
- 2018 Rainy River Dr
- 2102 Bunzel St
- 2107 Bunzel St