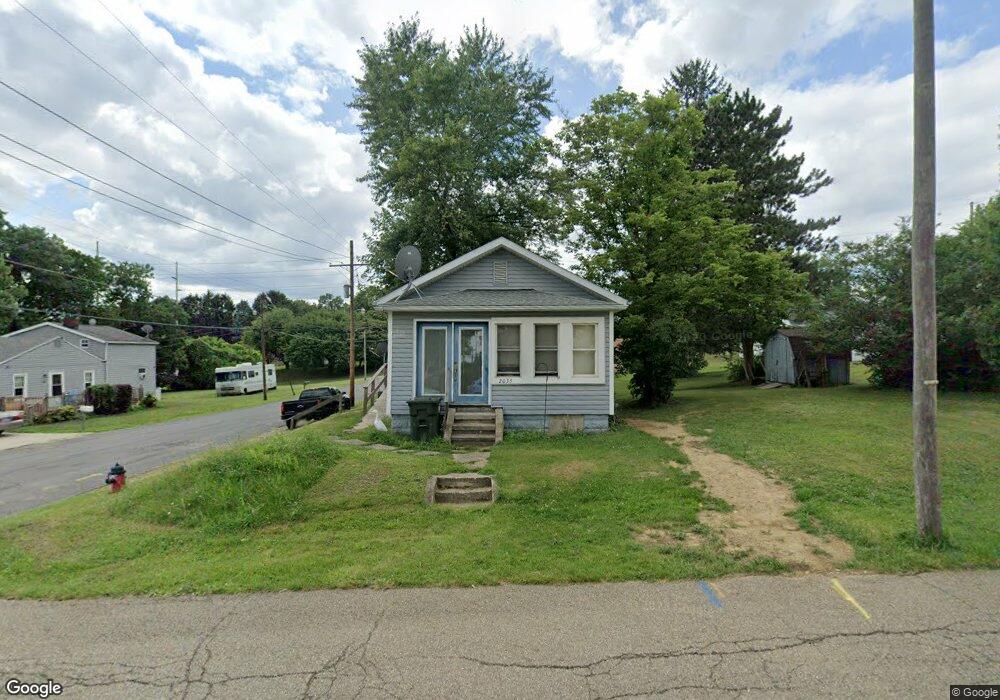
2035 Clarendon Ave SW Canton, OH 44706
Estimated Value: $70,812 - $99,000
2
Beds
1
Bath
720
Sq Ft
$113/Sq Ft
Est. Value
About This Home
This home is located at 2035 Clarendon Ave SW, Canton, OH 44706 and is currently estimated at $81,453, approximately $113 per square foot. 2035 Clarendon Ave SW is a home located in Stark County with nearby schools including Early Learning Center @ Schreiber, Cedar Elementary School, and McGregor Elementary School.
Ownership History
Date
Name
Owned For
Owner Type
Purchase Details
Closed on
Oct 6, 2010
Sold by
Chase Home Finance Llc
Bought by
Ravan Ohio Llc
Current Estimated Value
Purchase Details
Closed on
Jun 2, 2010
Sold by
Federal Home Loan Mortgage Corporation
Bought by
Chase Home Finance Llc
Purchase Details
Closed on
Jan 11, 2010
Sold by
Beaupre Valerie
Bought by
Federal Home Loan Mortgage Corp
Purchase Details
Closed on
May 3, 2007
Sold by
Baeupre Peter J and Beaupre Valerie T R
Bought by
Beaupre Valerie
Home Financials for this Owner
Home Financials are based on the most recent Mortgage that was taken out on this home.
Original Mortgage
$61,000
Interest Rate
6.21%
Mortgage Type
New Conventional
Purchase Details
Closed on
Nov 14, 2005
Sold by
Mercer Jeanne E and Domer Jd
Bought by
Beaupre Peter J and Beaupre Valerie T R
Create a Home Valuation Report for This Property
The Home Valuation Report is an in-depth analysis detailing your home's value as well as a comparison with similar homes in the area
Home Values in the Area
Average Home Value in this Area
Purchase History
| Date | Buyer | Sale Price | Title Company |
|---|---|---|---|
| Ravan Ohio Llc | $10,900 | Resource Title Agency Inc | |
| Chase Home Finance Llc | -- | None Available | |
| Federal Home Loan Mortgage Corp | $20,000 | None Available | |
| Beaupre Valerie | -- | Trident Title Agency Inc | |
| Beaupre Peter J | $26,000 | -- |
Source: Public Records
Mortgage History
| Date | Status | Borrower | Loan Amount |
|---|---|---|---|
| Previous Owner | Beaupre Valerie | $61,000 |
Source: Public Records
Tax History Compared to Growth
Tax History
| Year | Tax Paid | Tax Assessment Tax Assessment Total Assessment is a certain percentage of the fair market value that is determined by local assessors to be the total taxable value of land and additions on the property. | Land | Improvement |
|---|---|---|---|---|
| 2025 | -- | $18,170 | $3,890 | $14,280 |
| 2024 | -- | $18,170 | $3,890 | $14,280 |
| 2023 | $683 | $11,210 | $2,770 | $8,440 |
| 2022 | $663 | $11,210 | $2,770 | $8,440 |
| 2021 | $670 | $11,210 | $2,770 | $8,440 |
| 2020 | $642 | $9,630 | $2,380 | $7,250 |
| 2019 | $562 | $9,630 | $2,380 | $7,250 |
| 2018 | $572 | $9,630 | $2,380 | $7,250 |
| 2017 | $556 | $8,510 | $2,590 | $5,920 |
| 2016 | $557 | $8,510 | $2,590 | $5,920 |
| 2015 | $561 | $8,510 | $2,590 | $5,920 |
| 2014 | $638 | $9,110 | $2,770 | $6,340 |
| 2013 | $309 | $9,110 | $2,770 | $6,340 |
Source: Public Records
Map
Nearby Homes
- 2001 Bryan Ave SW
- 0 20th St SW
- 1622 Clarendon Ave SW
- 1547 Alden Ave SW
- 1700 Clark Ave SW
- 3204 14th St SW
- 1729 Gambrinus Ave SW
- 1361 Crescent Rd SW
- 1256 Dartmouth Ave SW
- 1227 Greenfield Ave SW
- 1214 Roslyn Ave SW
- 1219 Dueber Ave SW
- 1215 Dueber Ave SW
- 1019 Dartmouth Ave SW
- 2711 Blair Place SW
- 1023 Wertz Ave SW
- 1009 Arlington Ave SW
- 331 Millview Place SW
- 1356 Margaret Ave SW
- 1115 Dueber Ave SW
- 2604 21st St SW
- 2617 21st St SW
- 2019 Clarendon Ave SW
- 2519 21st St SW
- 2024 Clarendon Ave SW
- 2020 Frederick Ave SW
- 2106 Clarendon Ave SW
- 2115 Clarendon Ave SW
- 2014 Clarendon Ave SW
- 2604 20th St SW
- 2033 Bedford Ave SW
- 2118 Clarendon Ave SW
- 2123 Clarendon Ave SW
- 2520 20th St SW
- 2023 Bedford Ave SW
- 2105 Frederick Ave SW
- 2105 Frederick Ave SW
- 2105 Frederick Ave SW
- 2019 Bedford Ave SW
- 2023 Frederick Ave SW