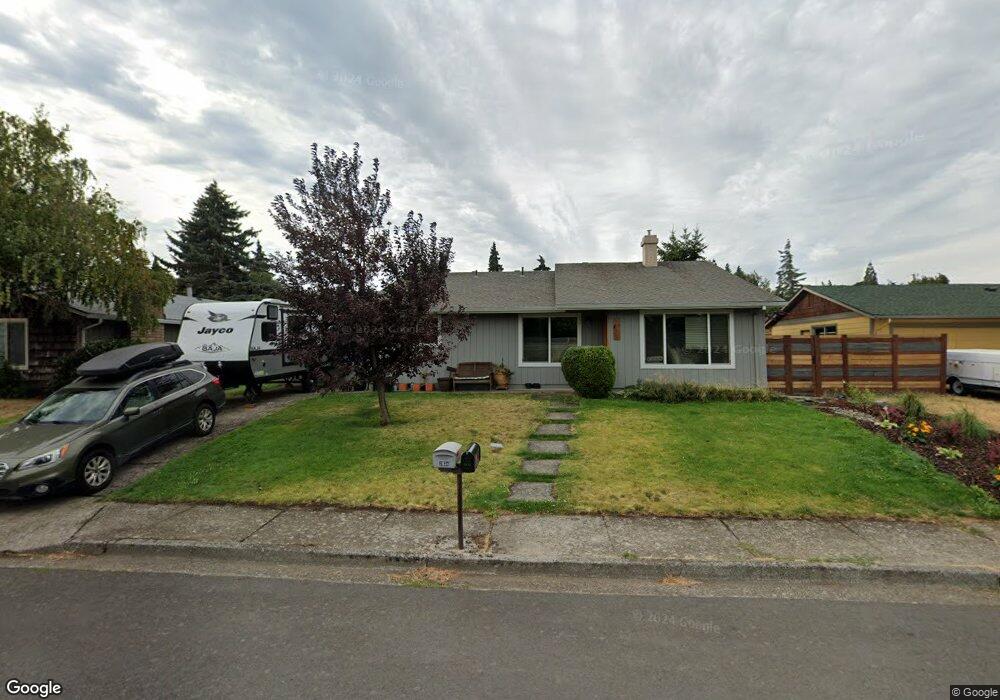
2035 Eugene St Hood River, OR 97031
Estimated Value: $588,347 - $647,000
3
Beds
2
Baths
1,500
Sq Ft
$412/Sq Ft
Est. Value
About This Home
This home is located at 2035 Eugene St, Hood River, OR 97031 and is currently estimated at $617,674, approximately $411 per square foot. 2035 Eugene St is a home located in Hood River County with nearby schools including May Street Elementary School, Hood River Middle School, and Hood River Valley High School.
Ownership History
Date
Name
Owned For
Owner Type
Purchase Details
Closed on
Apr 23, 2021
Sold by
Trenholm David R and Trenholm Erin E
Bought by
Trenholm Erin E and Trenholm David R
Current Estimated Value
Home Financials for this Owner
Home Financials are based on the most recent Mortgage that was taken out on this home.
Original Mortgage
$360,000
Outstanding Balance
$325,036
Interest Rate
3%
Mortgage Type
New Conventional
Estimated Equity
$292,638
Purchase Details
Closed on
Nov 19, 2012
Sold by
Johnston Dale M
Bought by
Trenholm David R and Rudolph Erin E
Home Financials for this Owner
Home Financials are based on the most recent Mortgage that was taken out on this home.
Original Mortgage
$246,775
Interest Rate
3.33%
Mortgage Type
New Conventional
Purchase Details
Closed on
Jun 29, 2009
Sold by
Colbo Michael A
Bought by
Johnston Dale M and Johnston Marilyn R
Home Financials for this Owner
Home Financials are based on the most recent Mortgage that was taken out on this home.
Original Mortgage
$194,025
Interest Rate
4.79%
Mortgage Type
New Conventional
Create a Home Valuation Report for This Property
The Home Valuation Report is an in-depth analysis detailing your home's value as well as a comparison with similar homes in the area
Home Values in the Area
Average Home Value in this Area
Purchase History
| Date | Buyer | Sale Price | Title Company |
|---|---|---|---|
| Trenholm Erin E | -- | Amerititle | |
| Trenholm David R | $256,000 | Columbia Gorge Title | |
| Johnston Dale M | -- | Amerititle |
Source: Public Records
Mortgage History
| Date | Status | Borrower | Loan Amount |
|---|---|---|---|
| Open | Trenholm Erin E | $360,000 | |
| Closed | Trenholm David R | $246,775 | |
| Previous Owner | Johnston Dale M | $194,025 |
Source: Public Records
Tax History Compared to Growth
Tax History
| Year | Tax Paid | Tax Assessment Tax Assessment Total Assessment is a certain percentage of the fair market value that is determined by local assessors to be the total taxable value of land and additions on the property. | Land | Improvement |
|---|---|---|---|---|
| 2024 | $3,189 | $213,120 | $142,080 | $71,040 |
| 2023 | $3,189 | $206,920 | $137,950 | $68,970 |
| 2022 | $2,947 | $200,900 | $55,560 | $145,340 |
| 2021 | $2,961 | $195,050 | $53,950 | $141,100 |
| 2020 | $2,863 | $189,370 | $52,380 | $136,990 |
| 2019 | $2,670 | $183,860 | $50,860 | $133,000 |
| 2018 | $2,698 | $178,510 | $49,380 | $129,130 |
| 2017 | $2,649 | $173,320 | $47,940 | $125,380 |
| 2016 | $2,582 | $168,280 | $46,550 | $121,730 |
| 2015 | $2,536 | $163,380 | $45,200 | $118,180 |
| 2014 | $2,497 | $158,630 | $43,890 | $114,740 |
| 2013 | -- | $154,010 | $42,620 | $111,390 |
Source: Public Records
Map
Nearby Homes
- 407 22nd St
- 1826 Armadale Ave
- 2217 Clearwater Ln
- 2260 Sherman Ave
- 440 Sherman Ct
- 9 N 20th St
- 201 Selkirk Ln
- 1804 Lincoln St Unit 1
- 1534 Lincoln St
- 929 Goose Way
- 3665 May St
- 1534 Solar Ln
- 2877 Hazel Ave
- 2455 Belmont Dr
- 1222 Lincoln St
- 1008 June St
- 2940 Montello Place
- 1706 Avalon Way Unit 30
- 1111 29th St
- 1105 29th St
- 2003 Eugene St
- 2077 Eugene St
- 2008 Montello Ave
- 2004 Montello Ave
- 2034 Eugene St
- 2116 Montello Ave
- 2076 Eugene St
- 2002 Eugene St
- 1825 Eugene St
- 2167 Eugene St
- 2116 Eugene St
- 1828 Montello Ave
- 2170 Eugene St
- 1824 Eugene St
- 503 22nd St
- 2178 Montello Ave
- 1819 Eugene St
- 2007 Montello Ave
- 2009 Montello Ave
- 2001 Montello Ave