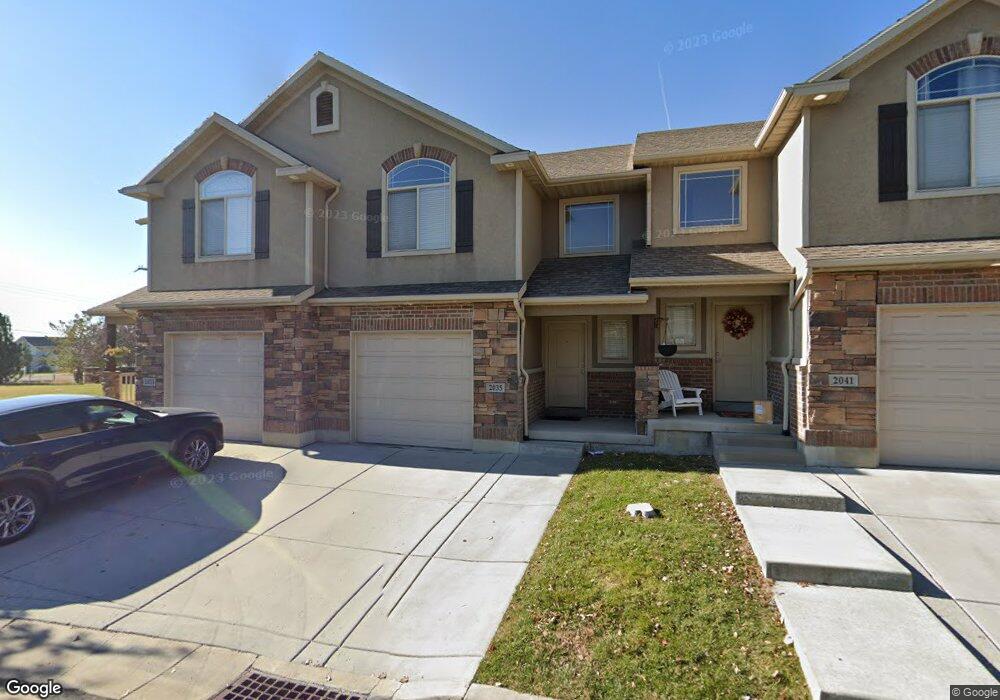
2035 Evans Cove Loop Unit 43 Layton, UT 84041
Estimated Value: $364,000 - $374,736
3
Beds
3
Baths
1,460
Sq Ft
$253/Sq Ft
Est. Value
About This Home
This home is located at 2035 Evans Cove Loop Unit 43, Layton, UT 84041 and is currently estimated at $368,934, approximately $252 per square foot. 2035 Evans Cove Loop Unit 43 is a home located in Davis County with nearby schools including Lincoln Elementary School, North Layton Junior High School, and Northridge High School.
Ownership History
Date
Name
Owned For
Owner Type
Purchase Details
Closed on
Dec 2, 2013
Sold by
Johner Theresa S and Jensen Theresa S
Bought by
Thandu Nataraj A
Current Estimated Value
Home Financials for this Owner
Home Financials are based on the most recent Mortgage that was taken out on this home.
Original Mortgage
$76,000
Outstanding Balance
$55,277
Interest Rate
3.62%
Mortgage Type
Adjustable Rate Mortgage/ARM
Estimated Equity
$313,657
Purchase Details
Closed on
Nov 1, 2006
Sold by
Nilson & Co Inc
Bought by
Johner Theresa S
Home Financials for this Owner
Home Financials are based on the most recent Mortgage that was taken out on this home.
Original Mortgage
$138,000
Interest Rate
6.36%
Mortgage Type
Purchase Money Mortgage
Create a Home Valuation Report for This Property
The Home Valuation Report is an in-depth analysis detailing your home's value as well as a comparison with similar homes in the area
Home Values in the Area
Average Home Value in this Area
Purchase History
| Date | Buyer | Sale Price | Title Company |
|---|---|---|---|
| Thandu Nataraj A | -- | Security Title Of Davis | |
| Johner Theresa S | -- | Bonneville Superior Title Co |
Source: Public Records
Mortgage History
| Date | Status | Borrower | Loan Amount |
|---|---|---|---|
| Open | Thandu Nataraj A | $76,000 | |
| Previous Owner | Johner Theresa S | $138,000 |
Source: Public Records
Tax History
| Year | Tax Paid | Tax Assessment Tax Assessment Total Assessment is a certain percentage of the fair market value that is determined by local assessors to be the total taxable value of land and additions on the property. | Land | Improvement |
|---|---|---|---|---|
| 2025 | $1,755 | $184,250 | $68,200 | $116,050 |
| 2024 | $1,701 | $179,850 | $52,250 | $127,600 |
| 2023 | $1,765 | $329,000 | $91,000 | $238,000 |
| 2022 | $1,788 | $180,950 | $45,650 | $135,300 |
| 2021 | $1,650 | $249,000 | $69,000 | $180,000 |
| 2020 | $1,519 | $220,000 | $51,000 | $169,000 |
| 2019 | $1,495 | $212,000 | $49,000 | $163,000 |
| 2018 | $1,341 | $191,000 | $49,000 | $142,000 |
| 2016 | $1,141 | $83,820 | $26,950 | $56,870 |
| 2015 | $1,125 | $78,430 | $26,950 | $51,480 |
| 2014 | $1,124 | $80,121 | $18,333 | $61,788 |
| 2013 | -- | $83,068 | $15,400 | $67,668 |
Source: Public Records
Map
Nearby Homes
- 1908 N 200 W
- 1857 N 50 W
- 14 W Belvedere Way
- 2214 N 450 W
- 2234 N 450 W
- 2246 N 475 W
- 1683 N 250 W
- 498 W 2200 N
- 506 W 2200 N
- 2186 N 525 W
- 2236 N 525 W
- 2500 N Fort Ln Unit 212
- 2500 N Fort Ln Unit 244
- 1571 N 160 W
- 2600 N Hill Field Rd Unit 134
- 2600 N Hill Field Rd Unit 4
- 579 W 2350 N
- 621 Paul Ave
- 2149 N 750 W
- 227 E 1500 N
- 2035 Evans Cove Loop
- 2041 Evans Cove Loop
- 2041 Evans Cove Loop Unit 42
- 2033 Evans Cove Loop
- 2033 Evans Cove Loop Unit 44
- 2045 Evans Cove Loop
- 2045 Evans Cove Loop Unit 41
- 2049 Evans Cove Loop
- 2049 Evans Cove Loop Unit 40
- 2053 Evans Cove Loop
- 2053 Evans Cove Loop Unit 39
- 2038 Evans Cove Loop
- 2038 Evans Cove Loop Unit 45
- 2061 Evans Cove Loop
- 2061 Evans Cove Loop Unit 38
- 2040 Evans Cove Loop
- 2040 Evans Cove Loop Unit 46
- 2046 Evans Cove Loop
- 2050 Evans Cove Loop
- 2050 Evans Cove Loop Unit 48
Your Personal Tour Guide
Ask me questions while you tour the home.