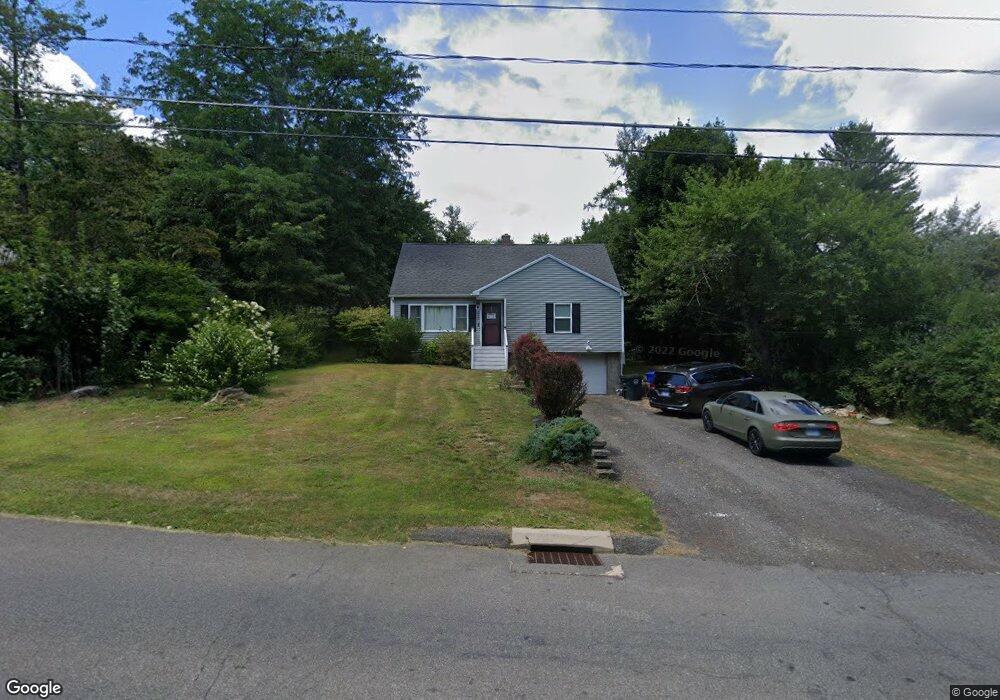
2035 Torringford West St Torrington, CT 06790
Estimated Value: $290,000 - $348,463
3
Beds
2
Baths
1,444
Sq Ft
$219/Sq Ft
Est. Value
About This Home
This home is located at 2035 Torringford West St, Torrington, CT 06790 and is currently estimated at $316,116, approximately $218 per square foot. 2035 Torringford West St is a home located in Litchfield County with nearby schools including Torrington Middle School, Torrington High School, and Torrington Christian Academy.
Ownership History
Date
Name
Owned For
Owner Type
Purchase Details
Closed on
Jan 16, 2025
Sold by
Lorenzo Nancy and Lorenzo Joseph
Bought by
Giacomini Diogo
Current Estimated Value
Home Financials for this Owner
Home Financials are based on the most recent Mortgage that was taken out on this home.
Original Mortgage
$245,319
Outstanding Balance
$243,545
Interest Rate
6.6%
Mortgage Type
FHA
Estimated Equity
$72,571
Purchase Details
Closed on
Mar 31, 2016
Sold by
Fnma
Bought by
Lorenzo Joseph and Obrien Nancy
Home Financials for this Owner
Home Financials are based on the most recent Mortgage that was taken out on this home.
Original Mortgage
$103,991
Interest Rate
3.65%
Mortgage Type
FHA
Purchase Details
Closed on
Jan 13, 2016
Sold by
Ditech Financial Llc
Bought by
Federal National Mortgage Association
Purchase Details
Closed on
May 29, 1991
Sold by
Mitchell Constance V
Bought by
Skoret Marguerite L
Create a Home Valuation Report for This Property
The Home Valuation Report is an in-depth analysis detailing your home's value as well as a comparison with similar homes in the area
Home Values in the Area
Average Home Value in this Area
Purchase History
| Date | Buyer | Sale Price | Title Company |
|---|---|---|---|
| Giacomini Diogo | $290,000 | None Available | |
| Giacomini Diogo | $290,000 | None Available | |
| Lorenzo Joseph | $75,000 | -- | |
| Lorenzo Joseph | $75,000 | -- | |
| Federal National Mortgage Association | -- | -- | |
| Federal National Mortgage Association | -- | -- | |
| Skoret Marguerite L | $104,500 | -- |
Source: Public Records
Mortgage History
| Date | Status | Borrower | Loan Amount |
|---|---|---|---|
| Open | Giacomini Diogo | $245,319 | |
| Closed | Giacomini Diogo | $245,319 | |
| Previous Owner | Skoret Marguerite L | $103,991 |
Source: Public Records
Tax History Compared to Growth
Tax History
| Year | Tax Paid | Tax Assessment Tax Assessment Total Assessment is a certain percentage of the fair market value that is determined by local assessors to be the total taxable value of land and additions on the property. | Land | Improvement |
|---|---|---|---|---|
| 2025 | $7,256 | $188,720 | $27,160 | $161,560 |
| 2024 | $4,111 | $85,700 | $23,770 | $61,930 |
| 2023 | $4,110 | $85,700 | $23,770 | $61,930 |
| 2022 | $4,040 | $85,700 | $23,770 | $61,930 |
| 2021 | $3,957 | $85,700 | $23,770 | $61,930 |
| 2020 | $3,957 | $85,700 | $23,770 | $61,930 |
| 2019 | $4,499 | $97,450 | $44,130 | $53,320 |
| 2018 | $4,499 | $97,450 | $44,130 | $53,320 |
| 2017 | $4,458 | $97,450 | $44,130 | $53,320 |
| 2016 | $4,458 | $97,450 | $44,130 | $53,320 |
| 2015 | $4,458 | $97,450 | $44,130 | $53,320 |
| 2014 | $5,012 | $138,000 | $67,940 | $70,060 |
Source: Public Records
Map
Nearby Homes
- 2376 Torringford St
- 70 Suncrest Ct
- KENNEDY DRIVE & Torringford St
- 67 Wysteria Ct
- 1275 Winsted Rd Unit 101
- 1275 Winsted Rd Unit 534
- 1275 Winsted Rd Unit 533
- 2651 Torringford St W
- 1229 Winsted Rd Unit 91
- 38 Auburn Way
- 1683 Torringford St
- 353A Hayden Hill Rd
- 96 Berkshire Oval Unit 96
- 260 Hayden Hill Rd
- 158 Cypress Ct Unit 158
- 190 Hayden Hill Rd
- 2793 Torringford St W
- 144 Spyglass Ct
- 145 Oxford Way
- 229 White Oak Way
- 2023 Torringford West St
- 2009 Torringford West St
- 1995 Torringford West St
- 50 Marshall St
- 62 Marshall St
- 2047 Torringford West St
- 36 Marshall St
- 68 Marshall St
- 22 Marshall St
- 4 Jordan Ln
- 80 Marshall St
- 2073 Torringford West St
- 22 Jordan Ln
- 51 Marshall St
- 37 Nilsen Ave
- 35 Marshall St
- 79 Marshall St
- 63 Marshall St
- 19 Marshall St
- 60 Jordan Ln