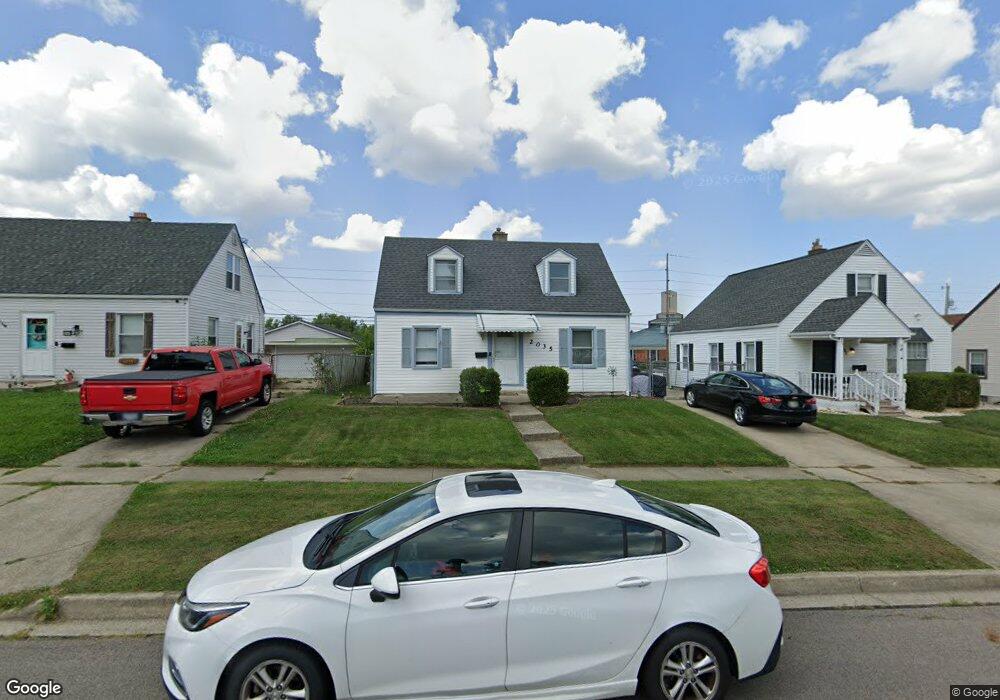
2035 W Bataan Dr Dayton, OH 45420
Estimated Value: $160,002 - $178,000
3
Beds
1
Bath
1,008
Sq Ft
$168/Sq Ft
Est. Value
About This Home
This home is located at 2035 W Bataan Dr, Dayton, OH 45420 and is currently estimated at $169,501, approximately $168 per square foot. 2035 W Bataan Dr is a home located in Montgomery County with nearby schools including Greenmont Elementary School, Kettering Middle School, and Kettering Fairmont High School.
Ownership History
Date
Name
Owned For
Owner Type
Purchase Details
Closed on
Nov 8, 2018
Sold by
Rogers Gloria M
Bought by
Smith Stephen T
Current Estimated Value
Home Financials for this Owner
Home Financials are based on the most recent Mortgage that was taken out on this home.
Original Mortgage
$76,109
Outstanding Balance
$66,526
Interest Rate
4.8%
Mortgage Type
FHA
Estimated Equity
$102,975
Purchase Details
Closed on
Oct 25, 2011
Sold by
Salo Glenn H and Salo Debra
Bought by
Rogers Gloria M
Purchase Details
Closed on
Nov 13, 1997
Sold by
Salo Glen H
Bought by
Salo Glen H and Salo Peggy
Purchase Details
Closed on
Oct 24, 1997
Sold by
Salo Glenn H and Salo Peggy V
Bought by
Salo Glen H
Purchase Details
Closed on
Mar 7, 1997
Sold by
Salo Glenn H and Salo Peggy V
Bought by
Salo Glenn H and Salo Peggy
Create a Home Valuation Report for This Property
The Home Valuation Report is an in-depth analysis detailing your home's value as well as a comparison with similar homes in the area
Home Values in the Area
Average Home Value in this Area
Purchase History
| Date | Buyer | Sale Price | Title Company |
|---|---|---|---|
| Smith Stephen T | $81,800 | First Central Title | |
| Rogers Gloria M | $52,000 | Attorney | |
| Salo Glen H | -- | -- | |
| Salo Glen H | $1,000 | -- | |
| Salo Glenn H | -- | -- |
Source: Public Records
Mortgage History
| Date | Status | Borrower | Loan Amount |
|---|---|---|---|
| Open | Smith Stephen T | $76,109 |
Source: Public Records
Tax History
| Year | Tax Paid | Tax Assessment Tax Assessment Total Assessment is a certain percentage of the fair market value that is determined by local assessors to be the total taxable value of land and additions on the property. | Land | Improvement |
|---|---|---|---|---|
| 2025 | $2,547 | $39,340 | $11,010 | $28,330 |
| 2024 | $2,475 | $39,340 | $11,010 | $28,330 |
| 2023 | $2,475 | $39,340 | $11,010 | $28,330 |
| 2022 | $2,191 | $27,460 | $7,700 | $19,760 |
| 2021 | $2,029 | $27,460 | $7,700 | $19,760 |
| 2020 | $2,035 | $27,460 | $7,700 | $19,760 |
| 2019 | $2,275 | $27,220 | $7,700 | $19,520 |
| 2018 | $2,287 | $27,220 | $7,700 | $19,520 |
| 2017 | $2,109 | $27,220 | $7,700 | $19,520 |
| 2016 | $1,976 | $23,920 | $7,700 | $16,220 |
| 2015 | $1,889 | $23,920 | $7,700 | $16,220 |
| 2014 | $1,889 | $23,920 | $7,700 | $16,220 |
| 2012 | -- | $30,170 | $8,400 | $21,770 |
Source: Public Records
Map
Nearby Homes
- 2291 Patterson Rd
- 1634 Horlacher Ave
- 1534 Horlacher Ave
- 2105 Pittsfield St
- 2004 Hazel Ave
- 1513 Horlacher Ave
- 1618 Briedweng Ave Unit 1616
- 1701 Rockhurst Ave
- 2408 Homeland Ct
- 2009 Hazel Ave
- 2251 Vale Dr
- 2301 Rockwell Ct
- 1814 Ewalt Ave
- 2618 Kennedy Ave
- 3019 Dwight Ave
- 1629 Beaver Creek Ln
- 1409 Highview Ave
- 1521 Beaver Creek Ln
- 1436 Glenn Abbey Dr
- 2808 Whitehorse Ave
- 2039 W Bataan Dr
- 2031 W Bataan Dr
- 2027 W Bataan Dr
- 2127 Adventure Dr
- 2023 W Bataan Dr
- 2034 W Bataan Dr
- 2042 W Bataan Dr
- 2030 W Bataan Dr
- 2019 W Bataan Dr
- 2108 Adventure Dr
- 2026 W Bataan Dr
- 2159 Adventure Dr
- 2022 W Bataan Dr
- 2015 W Bataan Dr
- 2107 W Bataan Dr
- 2163 Adventure Dr
- 2104 W Bataan Dr
- 2018 W Bataan Dr
- 2011 W Bataan Dr Unit 45
- 2029 Malcom Dr
Your Personal Tour Guide
Ask me questions while you tour the home.