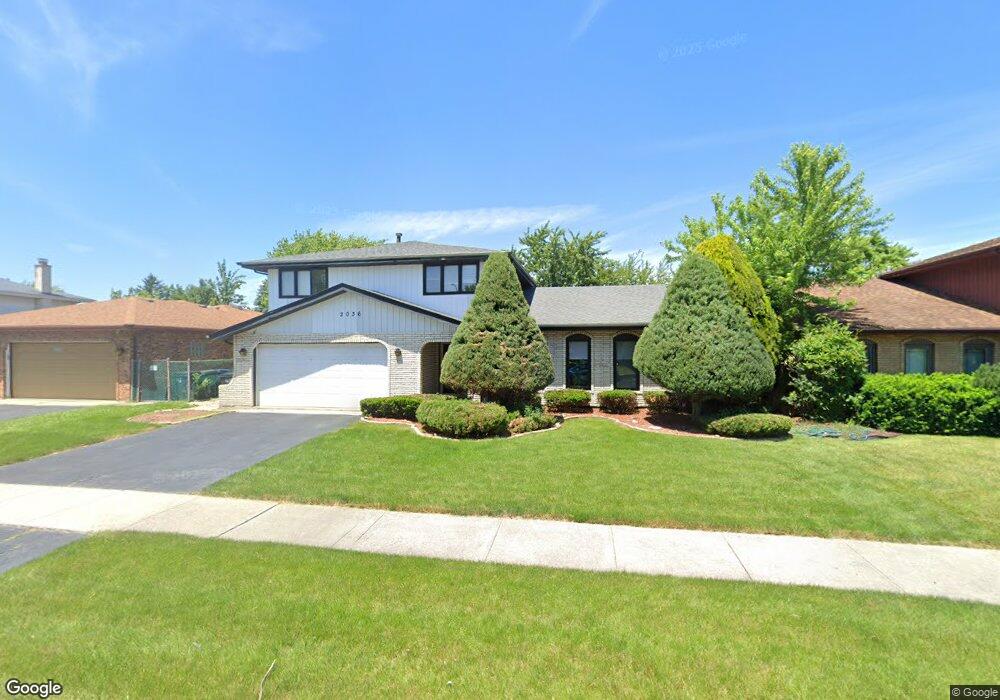
2036 E 172nd St South Holland, IL 60473
Estimated Value: $306,000 - $378,000
4
Beds
3
Baths
2,351
Sq Ft
$142/Sq Ft
Est. Value
About This Home
This home is located at 2036 E 172nd St, South Holland, IL 60473 and is currently estimated at $334,709, approximately $142 per square foot. 2036 E 172nd St is a home located in Cook County with nearby schools including Greenwood Elementary School, Mckinley Elementary School, and Mckinley Jr High School.
Ownership History
Date
Name
Owned For
Owner Type
Purchase Details
Closed on
Nov 5, 2020
Sold by
Carthan Clifford S and Carthan Marsha L
Bought by
Carthan Clifford S and Clifford S Carthan Living Trus
Current Estimated Value
Purchase Details
Closed on
Nov 26, 2018
Sold by
Carthan Clifford S and Carthan Marsha L
Bought by
Carthan Clifford S and Carthan Marsha L
Home Financials for this Owner
Home Financials are based on the most recent Mortgage that was taken out on this home.
Original Mortgage
$105,000
Outstanding Balance
$92,132
Interest Rate
4.6%
Mortgage Type
New Conventional
Estimated Equity
$242,577
Purchase Details
Closed on
Jun 3, 2005
Sold by
Carthan Pamela J
Bought by
Carthan Clifford S
Purchase Details
Closed on
Dec 4, 1998
Sold by
Ramirez Larry and Ramirez Donna
Bought by
Carthan Clifford and Carthan Pamela
Home Financials for this Owner
Home Financials are based on the most recent Mortgage that was taken out on this home.
Original Mortgage
$155,726
Interest Rate
6.93%
Mortgage Type
FHA
Create a Home Valuation Report for This Property
The Home Valuation Report is an in-depth analysis detailing your home's value as well as a comparison with similar homes in the area
Home Values in the Area
Average Home Value in this Area
Purchase History
| Date | Buyer | Sale Price | Title Company |
|---|---|---|---|
| Carthan Clifford S | -- | Attorney | |
| Carthan Clifford S | -- | Attorney | |
| Carthan Clifford S | -- | -- | |
| Carthan Clifford | $173,000 | -- |
Source: Public Records
Mortgage History
| Date | Status | Borrower | Loan Amount |
|---|---|---|---|
| Open | Carthan Clifford S | $105,000 | |
| Previous Owner | Carthan Clifford | $155,726 |
Source: Public Records
Tax History Compared to Growth
Tax History
| Year | Tax Paid | Tax Assessment Tax Assessment Total Assessment is a certain percentage of the fair market value that is determined by local assessors to be the total taxable value of land and additions on the property. | Land | Improvement |
|---|---|---|---|---|
| 2024 | $9,671 | $27,000 | $5,115 | $21,885 |
| 2023 | $7,804 | $27,000 | $5,115 | $21,885 |
| 2022 | $7,804 | $19,380 | $4,418 | $14,962 |
| 2021 | $7,586 | $19,379 | $4,417 | $14,962 |
| 2020 | $7,374 | $19,379 | $4,417 | $14,962 |
| 2019 | $7,456 | $19,830 | $3,720 | $16,110 |
| 2018 | $7,113 | $19,830 | $3,720 | $16,110 |
| 2017 | $7,009 | $19,830 | $3,720 | $16,110 |
| 2016 | $6,714 | $17,806 | $3,487 | $14,319 |
| 2015 | $7,295 | $17,806 | $3,487 | $14,319 |
| 2014 | $7,140 | $17,806 | $3,487 | $14,319 |
| 2013 | $7,547 | $20,083 | $3,487 | $16,596 |
Source: Public Records
Map
Nearby Homes
- 2024 E 171st Ct
- 17048 Clyde Ave
- 2005 Fairview Ln
- 1970 E 170th St
- 16909 Paxton Ave
- 2155 Bernice Rd
- 16822 Merrill Ave
- 16747 Paxton Ave
- 2237 175th St Unit 1B
- 2237 175th St Unit 2B
- 2304 Holiday Terrace Unit 503
- 2306 Holiday Terrace Unit 149
- 2306 Holiday Terrace Unit 163
- 2306 Holiday Terrace Unit 146
- 2216 177th St
- 2307 177th St
- 1991 Indiana Ave
- 17871 Locust St
- 500 Park Ave Unit 433
- 500 Park Ave Unit 238
- 2030 E 172nd St
- 2042 E 172nd St
- 2048 E 172nd St
- 2024 E 172nd St
- 2035 E 171st Place
- 2041 E 171st Place
- 2029 E 171st Place
- 2054 E 172nd St
- 2018 E 172nd St
- 2047 E 171st Place
- 2023 E 171st Place
- 2037 E 172nd St
- 2031 E 172nd St
- 2043 E 172nd St
- 2053 E 171st Place
- 2023 E 172nd St
- 2060 E 172nd St
- 2017 E 171st Place
- 2049 E 172nd St
- 17155 Paxton Ave