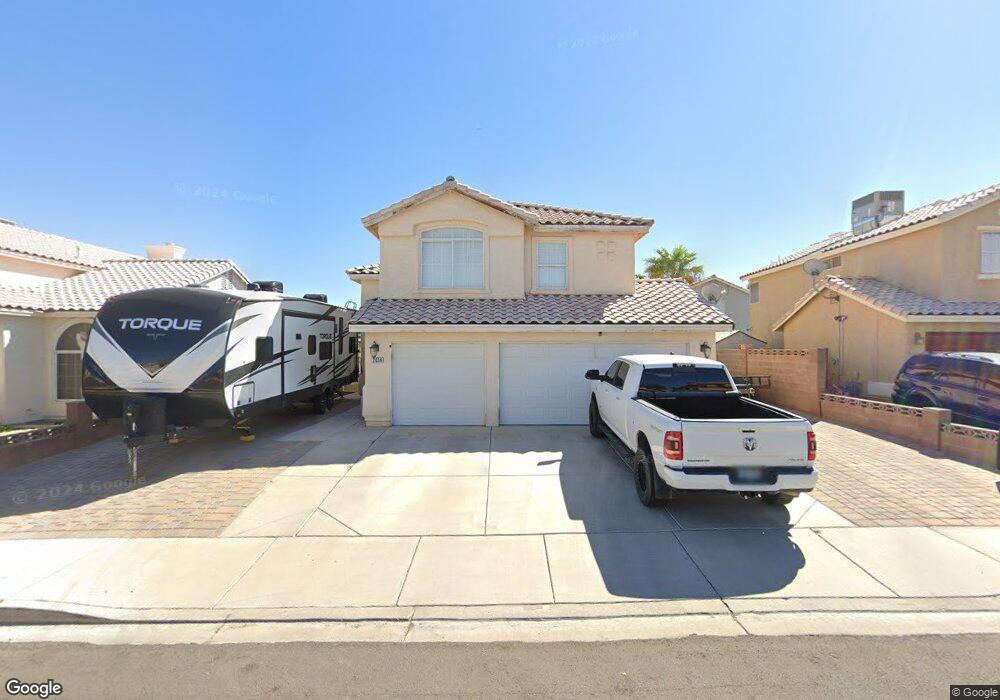
2036 Fallsburg Way Henderson, NV 89002
River Mountain NeighborhoodEstimated Value: $503,000 - $554,000
4
Beds
3
Baths
2,320
Sq Ft
$224/Sq Ft
Est. Value
About This Home
This home is located at 2036 Fallsburg Way, Henderson, NV 89002 and is currently estimated at $519,336, approximately $223 per square foot. 2036 Fallsburg Way is a home located in Clark County with nearby schools including John Dooley Elementary School, B Mahlon Brown Academy of International Studies, and Basic Academy of International Studies.
Ownership History
Date
Name
Owned For
Owner Type
Purchase Details
Closed on
May 23, 2012
Sold by
Castro Cecilia
Bought by
Casey Chad A
Current Estimated Value
Home Financials for this Owner
Home Financials are based on the most recent Mortgage that was taken out on this home.
Original Mortgage
$126,779
Outstanding Balance
$87,218
Interest Rate
3.75%
Mortgage Type
FHA
Estimated Equity
$432,118
Purchase Details
Closed on
Nov 5, 2007
Sold by
Gleich Mark L and Gleich Karen J
Bought by
Castro Cecilia
Home Financials for this Owner
Home Financials are based on the most recent Mortgage that was taken out on this home.
Original Mortgage
$335,000
Interest Rate
6.2%
Mortgage Type
Unknown
Purchase Details
Closed on
Mar 3, 1995
Sold by
Lewis Homes Tenaya Ltd Partnership
Bought by
Gleich Mark L and Gleich Karen J
Home Financials for this Owner
Home Financials are based on the most recent Mortgage that was taken out on this home.
Original Mortgage
$131,000
Interest Rate
6%
Create a Home Valuation Report for This Property
The Home Valuation Report is an in-depth analysis detailing your home's value as well as a comparison with similar homes in the area
Home Values in the Area
Average Home Value in this Area
Purchase History
| Date | Buyer | Sale Price | Title Company |
|---|---|---|---|
| Casey Chad A | $135,000 | Chicago Title Las Vegas | |
| Castro Cecilia | $335,000 | First Amer Title Co Of Nv | |
| Gleich Mark L | $138,000 | First American Title Company |
Source: Public Records
Mortgage History
| Date | Status | Borrower | Loan Amount |
|---|---|---|---|
| Open | Casey Chad A | $126,779 | |
| Previous Owner | Castro Cecilia | $335,000 | |
| Previous Owner | Gleich Mark L | $131,000 |
Source: Public Records
Tax History Compared to Growth
Tax History
| Year | Tax Paid | Tax Assessment Tax Assessment Total Assessment is a certain percentage of the fair market value that is determined by local assessors to be the total taxable value of land and additions on the property. | Land | Improvement |
|---|---|---|---|---|
| 2025 | $1,863 | $100,293 | $30,800 | $69,493 |
| 2024 | $1,809 | $100,293 | $30,800 | $69,493 |
| 2023 | $1,809 | $101,549 | $35,350 | $66,199 |
| 2022 | $1,757 | $92,211 | $31,500 | $60,711 |
| 2021 | $1,706 | $87,298 | $29,400 | $57,898 |
| 2020 | $1,653 | $85,239 | $27,650 | $57,589 |
| 2019 | $1,633 | $81,067 | $24,150 | $56,917 |
| 2018 | $1,558 | $73,728 | $19,250 | $54,478 |
| 2017 | $2,151 | $74,218 | $18,900 | $55,318 |
| 2016 | $1,459 | $65,368 | $9,800 | $55,568 |
| 2015 | $1,456 | $52,086 | $9,800 | $42,286 |
| 2014 | $1,413 | $47,325 | $9,800 | $37,525 |
Source: Public Records
Map
Nearby Homes
- 2031 Buckeye Reef St
- 1424 Colt Dr
- 1511 Rawhide Dr
- 1325 Baychester Dr
- 1290 Dalene Ave
- 2006 Darla St
- 2181 Maple Shade St
- 2011 Darla St
- 1581 Latigo Dr
- 2050 S Magic Way Unit 181
- 2050 S Magic Way Unit 20
- 2050 S Magic Way Unit 220
- 2050 S Magic Way Unit 271
- 2050 S Magic Way Unit 210
- 2050 S Magic Way Unit 66
- 2050 S Magic Way Unit 201
- 2050 S Magic Way Unit 26
- 2050 S Magic Way Unit 203
- 2050 S Magic Way Unit 290
- 2050 S Magic Way Unit 176
- 2030 Fallsburg Way
- 2042 Fallsburg Way
- 2037 Maple Springs St
- 2031 Maple Springs St
- 2043 Maple Springs St
- 2024 Fallsburg Way
- 2048 Fallsburg Way
- 2037 Fallsburg Way
- 2025 Maple Springs St
- 2049 Maple Springs St
- 2031 Fallsburg Way
- 2043 Fallsburg Way
- 2018 Fallsburg Way
- 2054 Fallsburg Way
- 2025 Fallsburg Way
- 2049 Fallsburg Way
- 2019 Maple Springs St
- 2055 Maple Springs St
- 2055 Fallsburg Way Unit n/a
- 2055 Fallsburg Way