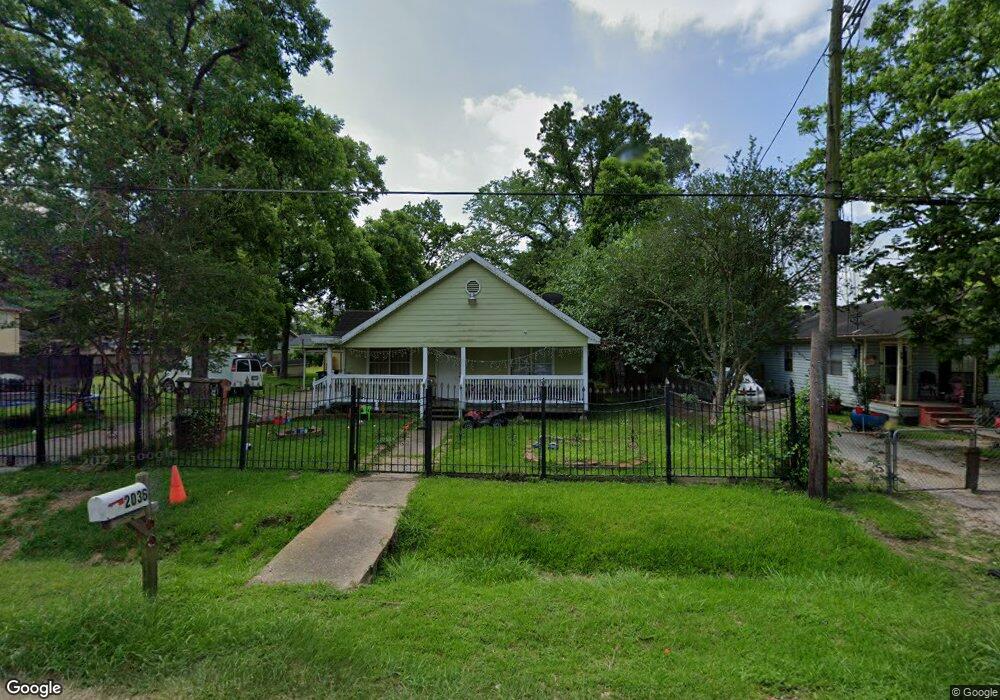
2036 Mcclelland St Houston, TX 77093
Eastex-Jensen NeighborhoodEstimated Value: $181,000 - $225,000
2
Beds
1
Bath
1,155
Sq Ft
$179/Sq Ft
Est. Value
About This Home
This home is located at 2036 Mcclelland St, Houston, TX 77093 and is currently estimated at $206,866, approximately $179 per square foot. 2036 Mcclelland St is a home located in Harris County with nearby schools including Berry Elementary School, Patrick Henry Middle School, and Kashmere High School.
Ownership History
Date
Name
Owned For
Owner Type
Purchase Details
Closed on
May 21, 2025
Sold by
Segovia Sergio and Segovia Silvia
Bought by
Garcia Gerardo
Current Estimated Value
Purchase Details
Closed on
Nov 28, 2023
Sold by
Segovia Sergio
Bought by
Segovia Noe and Ponce Steve
Purchase Details
Closed on
Aug 14, 2018
Sold by
Segovia Alonso
Bought by
Mota Noe Segova
Purchase Details
Closed on
Dec 3, 2007
Sold by
Sanchez Jose L and Sanchez Jose L
Bought by
Segovia Sergio
Home Financials for this Owner
Home Financials are based on the most recent Mortgage that was taken out on this home.
Original Mortgage
$127,205
Interest Rate
6.4%
Mortgage Type
Purchase Money Mortgage
Purchase Details
Closed on
Jan 8, 1999
Sold by
Sanchez Jose R
Bought by
Sanchez Jose Luis
Home Financials for this Owner
Home Financials are based on the most recent Mortgage that was taken out on this home.
Original Mortgage
$40,388
Interest Rate
6.68%
Mortgage Type
FHA
Create a Home Valuation Report for This Property
The Home Valuation Report is an in-depth analysis detailing your home's value as well as a comparison with similar homes in the area
Home Values in the Area
Average Home Value in this Area
Purchase History
| Date | Buyer | Sale Price | Title Company |
|---|---|---|---|
| Garcia Gerardo | -- | None Listed On Document | |
| Segovia Noe | -- | None Listed On Document | |
| Mota Noe Segova | -- | None Available | |
| Segovia Sergio | -- | Texas American Title Company | |
| Sanchez Jose Luis | -- | Houston Title Company |
Source: Public Records
Mortgage History
| Date | Status | Borrower | Loan Amount |
|---|---|---|---|
| Previous Owner | Segovia Sergio | $127,205 | |
| Previous Owner | Sanchez Jose Luis | $40,388 |
Source: Public Records
Tax History Compared to Growth
Tax History
| Year | Tax Paid | Tax Assessment Tax Assessment Total Assessment is a certain percentage of the fair market value that is determined by local assessors to be the total taxable value of land and additions on the property. | Land | Improvement |
|---|---|---|---|---|
| 2025 | $3,486 | $164,588 | $73,309 | $91,279 |
| 2024 | $3,486 | $166,590 | $73,309 | $93,281 |
| 2023 | $3,486 | $166,590 | $73,309 | $93,281 |
| 2022 | $3,072 | $139,529 | $61,579 | $77,950 |
| 2021 | $2,686 | $115,248 | $46,918 | $68,330 |
| 2020 | $2,642 | $109,105 | $46,918 | $62,187 |
| 2019 | $2,128 | $84,089 | $35,188 | $48,901 |
| 2018 | $1,682 | $66,456 | $23,459 | $42,997 |
| 2017 | $1,680 | $66,456 | $23,459 | $42,997 |
| 2016 | $1,680 | $66,456 | $23,459 | $42,997 |
| 2015 | $1,858 | $66,456 | $23,459 | $42,997 |
| 2014 | $1,858 | $72,270 | $23,459 | $48,811 |
Source: Public Records
Map
Nearby Homes
- 1928 E Crosstimbers St
- 2413 E Crosstimbers St
- 2401 Mcdaniel St
- 1817 Mcdaniel St
- 7722 West St
- 2520 E Crosstimbers St
- 2602 E Crosstimbers St
- 7718 Duncan St
- 2516 Vaughn St
- 2120 Vance St
- 7617 Jensen Dr
- 7307 Adelbert St
- 2017 Sadler St
- 2624 Deams St
- 7305 Jensen
- 2821 E Crosstimbers St
- 2608 Bostic St
- 2402 Bennington St
- 2630 Keeland St
- 8109 W Hardy Rd
- 2028 Mcclelland St
- 2408 Mcclelland St
- 2017 E Crosstimbers St
- 2004 Mcclelland St
- 2410 Mcclelland St
- 2107 E Crosstimbers St
- 2035 Mcclelland St
- 2105 E Crosstimbers St
- 2105 E Crosstimbers St
- 2015 E Crosstimbers St
- 2109 Crosstimbers St
- 2011 Mcclelland St
- 2002 Mcclelland St
- 2009 Mcclelland St
- 2003 E Crosstimbers St
- 2403 Mcclelland St
- 2013 Mcclelland St
- 2038 Mcclelland St
- 2111 E Crosstimbers St
- 2007 Mcclelland St