Estimated Value: $536,000 - $767,000
6
Beds
4
Baths
5,572
Sq Ft
$108/Sq Ft
Est. Value
About This Home
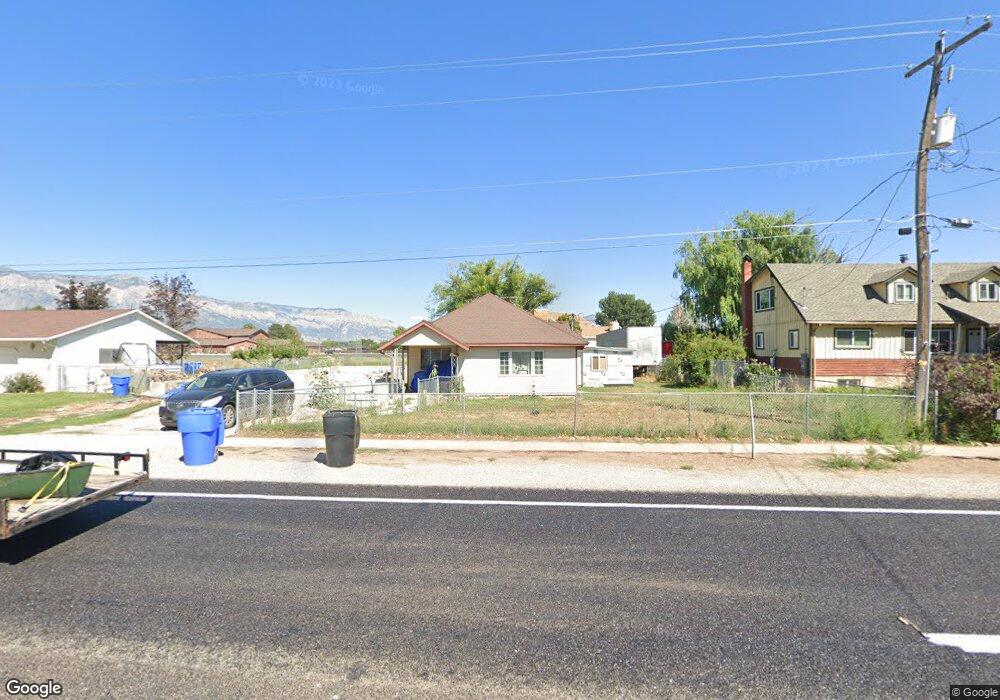
This home is located at 2036 N 4650 W, Ogden, UT 84404 and is currently estimated at $601,645, approximately $107 per square foot. 2036 N 4650 W is a home located in Weber County with nearby schools including Plain City School, Wahlquist Junior High School, and Fremont High School.
Ownership History
Date
Name
Owned For
Owner Type
Purchase Details
Closed on
May 18, 2021
Sold by
Stanger Richard
Bought by
Stanger Richard and Stanger Whitney
Current Estimated Value
Home Financials for this Owner
Home Financials are based on the most recent Mortgage that was taken out on this home.
Original Mortgage
$258,998
Outstanding Balance
$234,717
Interest Rate
3.1%
Mortgage Type
VA
Estimated Equity
$366,928
Purchase Details
Closed on
Sep 14, 2017
Sold by
Stanger Lloyd Winn
Bought by
Stanger Don R and Stanger Robyn B
Purchase Details
Closed on
Apr 14, 2017
Sold by
Stanger Meriam Jenkins
Bought by
Meriam Stranger Living Trust and Stanger Meriam Jenkings
Purchase Details
Closed on
Jan 21, 2009
Sold by
Stanger Meriam J and Stanger Lavor W
Bought by
Stanger Lavor W and Stanger Meriam J
Purchase Details
Closed on
Nov 29, 1996
Sold by
Stanger Meriam J
Bought by
Stanger Meriam J and Stanger Lavor W
Purchase Details
Closed on
Oct 17, 1979
Sold by
Jenkins Ellen Myers
Bought by
Stanger Meriam J
Create a Home Valuation Report for This Property
The Home Valuation Report is an in-depth analysis detailing your home's value as well as a comparison with similar homes in the area
Home Values in the Area
Average Home Value in this Area
Purchase History
| Date | Buyer | Sale Price | Title Company |
|---|---|---|---|
| Stanger Richard | -- | First American Title Ins Co | |
| Stanger Richard | -- | First American Title Ins Co | |
| Stanger Don R | -- | Us Title Insurance Agency | |
| Meriam Stranger Living Trust | -- | None Available | |
| Stanger Meriam Jenkins | -- | None Available | |
| Stanger Lavor W | -- | None Available | |
| Stanger Meriam J | -- | -- | |
| Stanger Meriam J | -- | -- |
Source: Public Records
Mortgage History
| Date | Status | Borrower | Loan Amount |
|---|---|---|---|
| Open | Stanger Richard | $258,998 |
Source: Public Records
Tax History Compared to Growth
Tax History
| Year | Tax Paid | Tax Assessment Tax Assessment Total Assessment is a certain percentage of the fair market value that is determined by local assessors to be the total taxable value of land and additions on the property. | Land | Improvement |
|---|---|---|---|---|
| 2025 | $392 | $401,988 | $156,680 | $245,308 |
| 2024 | $375 | $217,799 | $86,171 | $131,628 |
| 2023 | $1,787 | $168,300 | $77,945 | $90,355 |
| 2022 | $1,747 | $169,400 | $75,064 | $94,336 |
| 2021 | $1,672 | $274,000 | $66,112 | $207,888 |
| 2020 | $1,558 | $233,000 | $55,983 | $177,017 |
| 2019 | $1,463 | $204,000 | $50,744 | $153,256 |
| 2018 | $1,405 | $186,000 | $50,744 | $135,256 |
| 2017 | $1,224 | $149,000 | $44,568 | $104,432 |
| 2016 | $1,062 | $68,110 | $22,232 | $45,878 |
| 2015 | $1,034 | $64,444 | $22,232 | $42,212 |
| 2014 | $993 | $60,032 | $23,326 | $36,706 |
Source: Public Records
Map
Nearby Homes
- 2131 N 4650 W
- 1885 N 4475 W
- 4227 W Pioneer Rd
- 4210 W 1975 N
- 4494 W 1600 N
- 2416 N 4275 W
- 4370 W 1500 N
- 1748 N 4100 St W
- 3966 W 2200 N
- 3622 W 2200 St N Unit 23
- 2700 N 4200 W
- 1239 N 4925 W
- 2793 W 2775 N
- 2797 W 2775 N Unit 129
- 2782 W 2775 N Unit 105
- 2792 W 2775 N Unit 103
- 2787 W 2775 N Unit 127
- 2834 N 5150 W
- 4212 W 1975 N
- 1221 N 4975 W