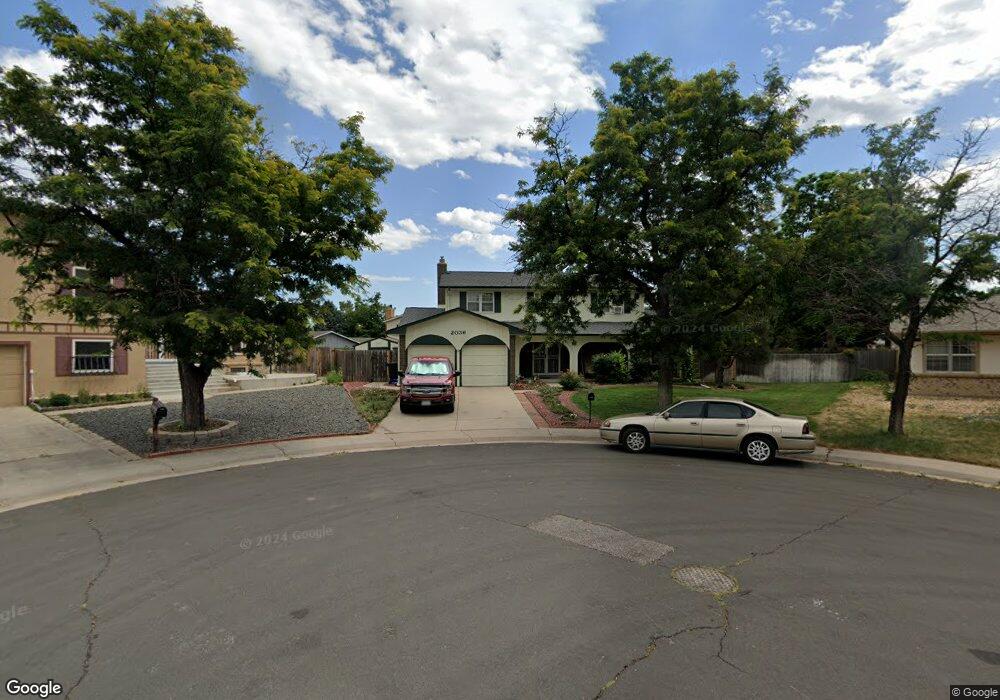
2036 S Newark Way Aurora, CO 80014
Village East NeighborhoodEstimated Value: $530,000 - $606,000
4
Beds
5
Baths
2,047
Sq Ft
$274/Sq Ft
Est. Value
About This Home
This home is located at 2036 S Newark Way, Aurora, CO 80014 and is currently estimated at $560,672, approximately $273 per square foot. 2036 S Newark Way is a home located in Arapahoe County with nearby schools including Ponderosa Elementary School, Prairie Middle School, and Overland High School.
Ownership History
Date
Name
Owned For
Owner Type
Purchase Details
Closed on
Sep 9, 2020
Sold by
Wasinger Ronald D and Wasinger Donna L
Bought by
Wasinger Family Trust
Current Estimated Value
Purchase Details
Closed on
Jun 15, 2001
Sold by
Newell Barbara A and Newell Harry J
Bought by
Wasinger Ronald D and Wasinger Donna L
Home Financials for this Owner
Home Financials are based on the most recent Mortgage that was taken out on this home.
Original Mortgage
$231,300
Interest Rate
7.16%
Purchase Details
Closed on
Dec 29, 1992
Sold by
Conversion Arapco
Bought by
Newell Barbara A Newell Harry J
Purchase Details
Closed on
May 1, 1975
Sold by
Conversion Arapco
Bought by
Conversion Arapco
Purchase Details
Closed on
Jul 4, 1776
Bought by
Conversion Arapco
Create a Home Valuation Report for This Property
The Home Valuation Report is an in-depth analysis detailing your home's value as well as a comparison with similar homes in the area
Home Values in the Area
Average Home Value in this Area
Purchase History
| Date | Buyer | Sale Price | Title Company |
|---|---|---|---|
| Wasinger Family Trust | -- | None Listed On Document | |
| Wasinger Ronald D | $257,000 | -- | |
| Newell Barbara A Newell Harry J | -- | -- | |
| Conversion Arapco | -- | -- | |
| Conversion Arapco | -- | -- |
Source: Public Records
Mortgage History
| Date | Status | Borrower | Loan Amount |
|---|---|---|---|
| Previous Owner | Wasinger Ronald D | $231,300 |
Source: Public Records
Tax History Compared to Growth
Tax History
| Year | Tax Paid | Tax Assessment Tax Assessment Total Assessment is a certain percentage of the fair market value that is determined by local assessors to be the total taxable value of land and additions on the property. | Land | Improvement |
|---|---|---|---|---|
| 2024 | $1,891 | $34,036 | -- | -- |
| 2023 | $1,891 | $34,036 | $0 | $0 |
| 2022 | $1,604 | $29,100 | $0 | $0 |
| 2021 | $1,614 | $29,100 | $0 | $0 |
| 2020 | $1,582 | $29,186 | $0 | $0 |
| 2019 | $1,527 | $29,186 | $0 | $0 |
| 2018 | $1,254 | $24,206 | $0 | $0 |
| 2017 | $1,236 | $24,206 | $0 | $0 |
| 2016 | $1,112 | $22,304 | $0 | $0 |
| 2015 | $1,058 | $22,304 | $0 | $0 |
| 2014 | $671 | $16,023 | $0 | $0 |
| 2013 | -- | $17,910 | $0 | $0 |
Source: Public Records
Map
Nearby Homes
- 2017 S Nome St
- 1923 S Newark Way
- 1977 S Oakland Way
- 11742 E Jewell Place
- 1960 S Lansing Ct
- 11457 E Warren Place
- 2216 S Nile Ct
- 1987 S Peoria St
- 2297 S Oswego Way
- 1997 S Peoria St
- 1925 S Peoria St
- 2238 S Nile Ct
- 1958 S Kingston Ct
- 2242 S Moline Ct
- 2280 S Oswego Way Unit 104
- 2280 S Oswego Way Unit 105
- 2280 S Oswego Way Unit 303
- 1967 S Kingston Ct
- 11306 E Colorado Dr
- 2247 S Lima Ct
- 2046 S Newark Way
- 2026 S Newark Way
- 2037 S Nome St
- 2007 S Nome St
- 2016 S Newark Way
- 2006 S Newark Way
- 2066 S Newark Way
- 1995 S Nome St
- 2047 S Nome St
- 2025 S Newark Way
- 2015 S Newark Way
- 1984 S Newark Way
- 2035 S Newark Way
- 2057 S Nome St
- 1985 S Nome St
- 2005 S Newark Way
- 1994 S Newark Way
- 2055 S Newark Way
- 11579 E Asbury Place
- 11599 E Asbury Place