Estimated Value: $360,000 - $420,000
2
Beds
2
Baths
1,200
Sq Ft
$329/Sq Ft
Est. Value
About This Home
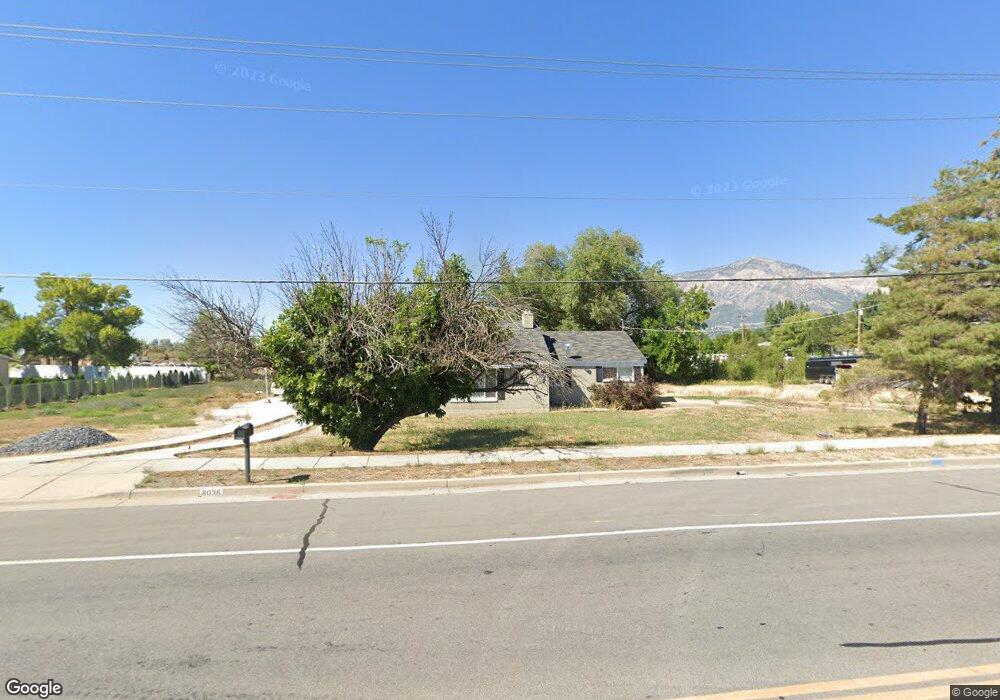
This home is located at 2036 W 1800 N, Ogden, UT 84404 and is currently estimated at $394,656, approximately $328 per square foot. 2036 W 1800 N is a home located in Weber County with nearby schools including Farr West Elementary School, Wahlquist Junior High School, and Fremont High School.
Ownership History
Date
Name
Owned For
Owner Type
Purchase Details
Closed on
Aug 26, 2014
Sold by
Monson Natalie A
Bought by
Castillo Adam S
Current Estimated Value
Home Financials for this Owner
Home Financials are based on the most recent Mortgage that was taken out on this home.
Original Mortgage
$142,900
Outstanding Balance
$109,278
Interest Rate
4.11%
Mortgage Type
VA
Estimated Equity
$285,378
Purchase Details
Closed on
Mar 14, 2014
Sold by
Wells Fargo Bank Na
Bought by
Monson Natalie A
Purchase Details
Closed on
Sep 26, 2013
Sold by
Baker Thomas D and Baker Toni J
Bought by
Wells Fargo Bank Na
Purchase Details
Closed on
Oct 30, 2003
Sold by
Davis Richard W
Bought by
Baker Thomas D
Create a Home Valuation Report for This Property
The Home Valuation Report is an in-depth analysis detailing your home's value as well as a comparison with similar homes in the area
Home Values in the Area
Average Home Value in this Area
Purchase History
| Date | Buyer | Sale Price | Title Company |
|---|---|---|---|
| Castillo Adam S | -- | Inwest Title Services | |
| Monson Natalie A | -- | None Available | |
| Wells Fargo Bank Na | $83,671 | Etitle Insurance Agency | |
| Baker Thomas D | -- | -- |
Source: Public Records
Mortgage History
| Date | Status | Borrower | Loan Amount |
|---|---|---|---|
| Open | Castillo Adam S | $142,900 |
Source: Public Records
Tax History Compared to Growth
Tax History
| Year | Tax Paid | Tax Assessment Tax Assessment Total Assessment is a certain percentage of the fair market value that is determined by local assessors to be the total taxable value of land and additions on the property. | Land | Improvement |
|---|---|---|---|---|
| 2025 | $505 | $392,743 | $157,170 | $235,573 |
| 2024 | $218 | $212,849 | $86,445 | $126,404 |
| 2023 | $199 | $205,700 | $86,436 | $119,264 |
| 2022 | $181 | $196,900 | $75,403 | $121,497 |
| 2021 | $178 | $250,000 | $107,627 | $142,373 |
| 2020 | $174 | $216,000 | $47,600 | $168,400 |
| 2019 | $174 | $192,000 | $47,499 | $144,501 |
| 2018 | $995 | $161,000 | $47,499 | $113,501 |
| 2017 | $876 | $141,000 | $40,586 | $100,414 |
| 2016 | $742 | $67,159 | $22,387 | $44,772 |
| 2015 | $753 | $67,160 | $24,030 | $43,130 |
| 2014 | $1,114 | $66,029 | $28,525 | $37,504 |
Source: Public Records
Map
Nearby Homes
- 1838 N 2000 W
- 2268 W 1800 N
- 1933 N 1700 W
- 1410 N 1900 W
- 9175 W 900 S Unit 345
- 1111 N 2000 W Unit 52
- 1111 N 2000 W Unit 123
- 1111 N 2000 W Unit 335
- 1111 N 2000 W Unit 170
- 1111 N 2000 W Unit 87
- 1111 N 2000 W Unit 222
- 1111 N 2000 W Unit 404
- 1111 N 2000 W Unit 84
- 1111 N 2000 W Unit 201
- 1111 N 2000 W Unit 197
- 1111 N 2000 W Unit 155
- 1111 N 2000 W Unit 12
- 1111 N 2000 W Unit 8
- 2124 Heritage Dr
- 2172 N 2625 W
- 2040 W 1800 N
- 1819 N 2000 W
- 1761 N 2000 W
- 1845 N 2000 W
- 1859 N 2000 W
- 1812 N 2000 W
- 1812 N 2000 W Unit 7
- 1812 N 2000 W Unit 9
- 1812 N 2000 W Unit 4
- 1812 N 2000 W Unit 3
- 1812 N 2000 W Unit 8
- 1812 N 2000 Main W Unit 8
- 1741 N 2000 W
- 1880 N 2000 W
- 1869 N 2000 W
- 1862 N 2000 W
- 1873 N 2000 W
- 1877 N 2000 W
- 1882 N 2000 W
- 1895 N 2000 W