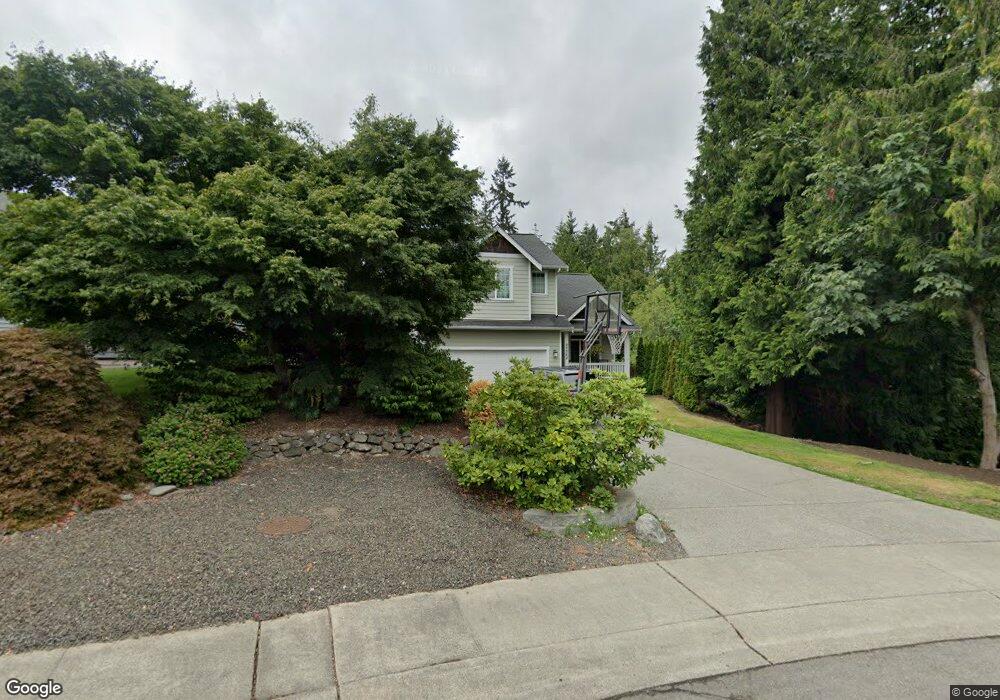
20365 Hoved Rd Poulsbo, WA 98370
Estimated Value: $653,603 - $714,000
3
Beds
3
Baths
2,169
Sq Ft
$314/Sq Ft
Est. Value
About This Home
This home is located at 20365 Hoved Rd, Poulsbo, WA 98370 and is currently estimated at $681,401, approximately $314 per square foot. 20365 Hoved Rd is a home located in Kitsap County with nearby schools including Poulsbo Elementary School, Poulsbo Middle School, and North Kitsap High School.
Ownership History
Date
Name
Owned For
Owner Type
Purchase Details
Closed on
Apr 19, 2006
Sold by
Ab General Contractors Inc
Bought by
Meek Adam C and Meek Angela B
Current Estimated Value
Home Financials for this Owner
Home Financials are based on the most recent Mortgage that was taken out on this home.
Original Mortgage
$215,000
Outstanding Balance
$123,482
Interest Rate
6.35%
Mortgage Type
Fannie Mae Freddie Mac
Estimated Equity
$557,919
Purchase Details
Closed on
Jun 15, 2005
Sold by
Patmon David P and Patmon Frances N
Bought by
A B General Contractors Inc
Purchase Details
Closed on
Mar 28, 2002
Sold by
Forest Rock Hills Associates
Bought by
Patmon David P and Patmon Frances N
Home Financials for this Owner
Home Financials are based on the most recent Mortgage that was taken out on this home.
Original Mortgage
$15,000
Interest Rate
6.84%
Mortgage Type
Seller Take Back
Create a Home Valuation Report for This Property
The Home Valuation Report is an in-depth analysis detailing your home's value as well as a comparison with similar homes in the area
Home Values in the Area
Average Home Value in this Area
Purchase History
| Date | Buyer | Sale Price | Title Company |
|---|---|---|---|
| Meek Adam C | $397,280 | Land Title Company | |
| A B General Contractors Inc | $60,000 | Land Title Company | |
| Patmon David P | $20,000 | Land Title Co |
Source: Public Records
Mortgage History
| Date | Status | Borrower | Loan Amount |
|---|---|---|---|
| Open | Meek Adam C | $215,000 | |
| Previous Owner | Patmon David P | $15,000 |
Source: Public Records
Tax History Compared to Growth
Tax History
| Year | Tax Paid | Tax Assessment Tax Assessment Total Assessment is a certain percentage of the fair market value that is determined by local assessors to be the total taxable value of land and additions on the property. | Land | Improvement |
|---|---|---|---|---|
| 2026 | $5,218 | $581,530 | $121,840 | $459,690 |
| 2025 | $5,218 | $581,530 | $121,840 | $459,690 |
| 2024 | $4,866 | $558,360 | $113,930 | $444,430 |
| 2023 | $4,949 | $558,360 | $113,930 | $444,430 |
| 2022 | $4,406 | $472,630 | $98,900 | $373,730 |
| 2021 | $4,274 | $424,900 | $88,610 | $336,290 |
| 2020 | $4,161 | $406,400 | $84,660 | $321,740 |
| 2019 | $3,913 | $382,140 | $79,120 | $303,020 |
| 2018 | $4,066 | $338,360 | $60,020 | $278,340 |
| 2017 | $3,889 | $338,360 | $60,020 | $278,340 |
| 2016 | $3,983 | $319,280 | $60,020 | $259,260 |
| 2015 | $3,844 | $309,730 | $60,020 | $249,710 |
| 2014 | -- | $296,380 | $60,020 | $236,360 |
| 2013 | -- | $296,380 | $60,020 | $236,360 |
Source: Public Records
Map
Nearby Homes
- 20165 Bue Rund Loop NE
- 1343 Lena Place NE
- 1711 NE Outlook Way
- 1257 Cameo Ct NE
- 20248 Pugh Rd NE
- 20274 Pugh Rd NE
- 456 Little Valley Rd NE
- 1330 NE Watland St
- 123 Pugh Rd NE
- 0 Bond Rd NE
- 19370 NE Larson Ct
- 20145 Vikings Crest Loop NE Unit 3-204
- 20050 Vikings Crest Loop NE Unit 2-301
- 20249 State Highway 305 NE
- 2496 NE Ariel Ct
- 1754 NE Mesford Rd Unit 12
- 1754 NE Mesford Rd Unit 28
- 2416 NE Dynasty Dr
- 2776 NE Noll Valley Loop
- 19795 4th Ave NE
- 20335 Hoved Rd
- 20360 12th Ave NE
- 20315 Hoved Rd
- 20382 12th Ave NE
- 20320 Hoved Rd
- 20334 12th Ave NE
- 20285 Hoved Rd
- 20310 12th Ave NE
- 1516 Nordic Place
- 20330 Hoved Rd
- 20390 Hoved Rd
- 1546 Nordic Place
- 20360 Hoved Rd
- 20349 12th Ave NE
- 20282 12th Ave NE
- 20265 Hoved Rd
- 20375 12th Ave NE
- 1566 Nordic Place
- 20325 12th Ave NE
- 20262 12th Ave NE