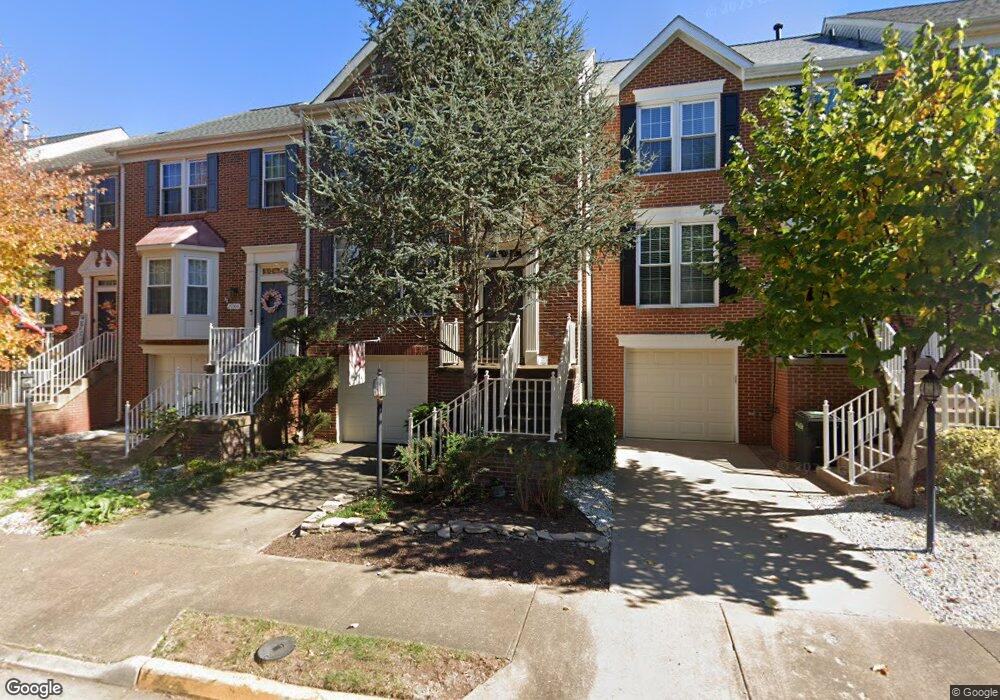
20368 Burnley Square Sterling, VA 20165
Estimated Value: $605,473 - $631,000
3
Beds
4
Baths
1,932
Sq Ft
$323/Sq Ft
Est. Value
About This Home
This home is located at 20368 Burnley Square, Sterling, VA 20165 and is currently estimated at $623,618, approximately $322 per square foot. 20368 Burnley Square is a home located in Loudoun County with nearby schools including Algonkian Elementary School, River Bend Middle School, and Potomac Falls High School.
Ownership History
Date
Name
Owned For
Owner Type
Purchase Details
Closed on
Apr 29, 2003
Sold by
Saunders Fannie
Bought by
Deramus Jane
Current Estimated Value
Home Financials for this Owner
Home Financials are based on the most recent Mortgage that was taken out on this home.
Original Mortgage
$202,400
Outstanding Balance
$87,005
Interest Rate
5.64%
Mortgage Type
New Conventional
Estimated Equity
$536,613
Create a Home Valuation Report for This Property
The Home Valuation Report is an in-depth analysis detailing your home's value as well as a comparison with similar homes in the area
Home Values in the Area
Average Home Value in this Area
Purchase History
| Date | Buyer | Sale Price | Title Company |
|---|---|---|---|
| Deramus Jane | $253,000 | -- |
Source: Public Records
Mortgage History
| Date | Status | Borrower | Loan Amount |
|---|---|---|---|
| Open | Deramus Jane | $202,400 |
Source: Public Records
Tax History Compared to Growth
Tax History
| Year | Tax Paid | Tax Assessment Tax Assessment Total Assessment is a certain percentage of the fair market value that is determined by local assessors to be the total taxable value of land and additions on the property. | Land | Improvement |
|---|---|---|---|---|
| 2025 | $4,548 | $564,980 | $190,000 | $374,980 |
| 2024 | $4,655 | $538,150 | $175,000 | $363,150 |
| 2023 | $4,486 | $512,720 | $175,000 | $337,720 |
| 2022 | $4,314 | $484,700 | $150,000 | $334,700 |
| 2021 | $4,206 | $429,170 | $130,000 | $299,170 |
| 2020 | $4,111 | $397,240 | $125,000 | $272,240 |
| 2019 | $3,975 | $380,420 | $125,000 | $255,420 |
| 2018 | $3,965 | $365,400 | $125,000 | $240,400 |
| 2017 | $3,964 | $352,340 | $125,000 | $227,340 |
| 2016 | $3,989 | $348,420 | $0 | $0 |
| 2015 | $3,967 | $224,500 | $0 | $224,500 |
| 2014 | $4,012 | $222,320 | $0 | $222,320 |
Source: Public Records
Map
Nearby Homes
- 20419 Riverbend Square Unit 301
- 46606 Drysdale Terrace Unit 101
- 46608 Drysdale Terrace Unit 101
- 46675 Cavendish Square
- 46622 Drysdale Terrace Unit 100
- 46685 Joubert Terrace
- 20597 Glenmere Square
- 20544 Morningside Terrace
- 46809 Trailwood Place
- 20687 Smithfield Ct
- 20594 Shadow Woods Ct
- 110 Sugarland Run Dr
- 105 Woodgate Ct
- 203 Greenfield Ct
- 86 Sugarland Run Dr
- 20627 Cutwater Place
- 126 Hillsdale Dr
- 6 Sugarland Square Ct
- 7 S Lowery Ct
- 25 Jefferson Dr
- 20366 Burnley Square
- 20364 Burnley Square
- 20370 Burnley Square
- 20362 Burnley Square Unit 101
- 20362 Burnley Square
- 20372 Burnley Square
- 20358 Burnley Square
- 20335 Burnley Square
- 46671 Lynnhaven Square
- 20356 Burnley Square
- 46646 Lynnhaven Square
- 20333 Burnley Square
- 46673 Lynnhaven Square
- 20354 Burnley Square
- 46644 Lynnhaven Square
- 20331 Burnley Square
- 46675 Lynnhaven Square
- 20352 Burnley Square
- 46642 Lynnhaven Square
- 20329 Burnley Square