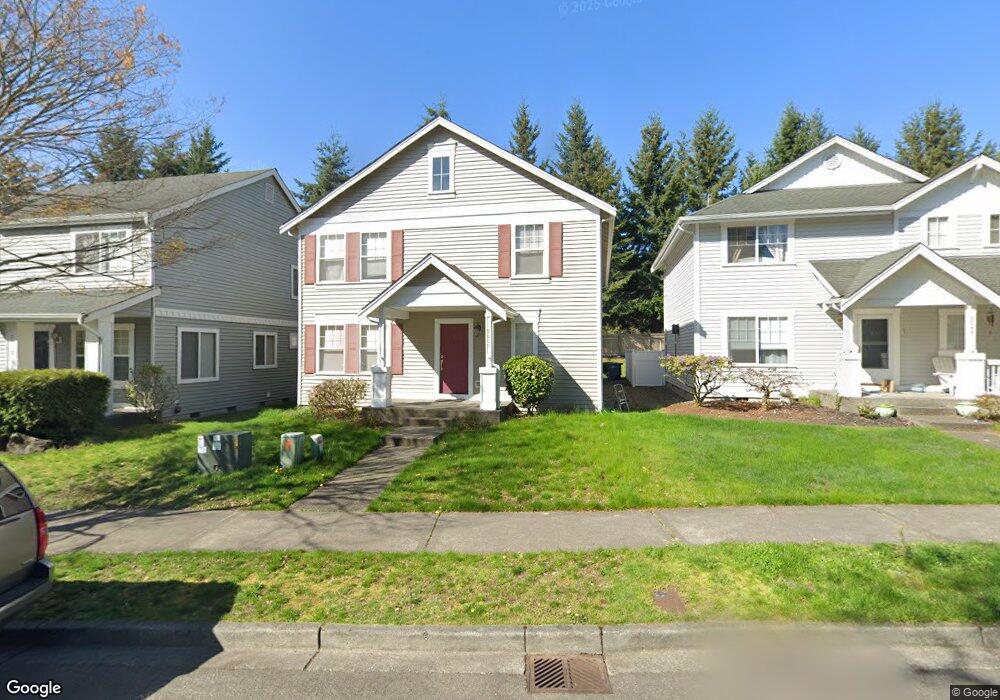
2037 McDonald Ave Dupont, WA 98327
Estimated Value: $528,620 - $589,000
3
Beds
3
Baths
2,120
Sq Ft
$264/Sq Ft
Est. Value
About This Home
This home is located at 2037 McDonald Ave, Dupont, WA 98327 and is currently estimated at $559,655, approximately $263 per square foot. 2037 McDonald Ave is a home located in Pierce County with nearby schools including Chloe Clark Elementary School, Saltars Point Elementary School, and Pioneer Middle School.
Ownership History
Date
Name
Owned For
Owner Type
Purchase Details
Closed on
Sep 13, 2006
Sold by
Behzad Elham
Bought by
Aref Amir
Current Estimated Value
Home Financials for this Owner
Home Financials are based on the most recent Mortgage that was taken out on this home.
Original Mortgage
$228,000
Outstanding Balance
$137,519
Interest Rate
6.75%
Mortgage Type
New Conventional
Estimated Equity
$422,136
Purchase Details
Closed on
Sep 12, 2006
Sold by
Brazell Rodney E and Brazell Heather J
Bought by
Aref Amir
Home Financials for this Owner
Home Financials are based on the most recent Mortgage that was taken out on this home.
Original Mortgage
$228,000
Outstanding Balance
$137,519
Interest Rate
6.75%
Mortgage Type
New Conventional
Estimated Equity
$422,136
Purchase Details
Closed on
Nov 15, 1999
Sold by
The Quadrant Corp
Bought by
Brazell Rodney E and Freed Heather J
Home Financials for this Owner
Home Financials are based on the most recent Mortgage that was taken out on this home.
Original Mortgage
$164,950
Interest Rate
7.84%
Create a Home Valuation Report for This Property
The Home Valuation Report is an in-depth analysis detailing your home's value as well as a comparison with similar homes in the area
Home Values in the Area
Average Home Value in this Area
Purchase History
| Date | Buyer | Sale Price | Title Company |
|---|---|---|---|
| Aref Amir | -- | Fidelity National Title | |
| Aref Amir | $285,000 | Fidelity National Title Insu | |
| Brazell Rodney E | $202,233 | Chicago Title |
Source: Public Records
Mortgage History
| Date | Status | Borrower | Loan Amount |
|---|---|---|---|
| Open | Aref Amir | $228,000 | |
| Previous Owner | Brazell Rodney E | $164,950 |
Source: Public Records
Tax History Compared to Growth
Tax History
| Year | Tax Paid | Tax Assessment Tax Assessment Total Assessment is a certain percentage of the fair market value that is determined by local assessors to be the total taxable value of land and additions on the property. | Land | Improvement |
|---|---|---|---|---|
| 2025 | $3,649 | $505,600 | $203,700 | $301,900 |
| 2024 | $3,649 | $482,400 | $196,200 | $286,200 |
| 2023 | $3,649 | $450,400 | $181,200 | $269,200 |
| 2022 | $3,630 | $458,500 | $181,200 | $277,300 |
| 2021 | $3,470 | $342,800 | $115,100 | $227,700 |
| 2019 | $3,086 | $312,500 | $95,900 | $216,600 |
| 2018 | $3,307 | $300,000 | $95,900 | $204,100 |
| 2017 | $2,971 | $281,700 | $80,600 | $201,100 |
| 2016 | $2,839 | $253,400 | $68,000 | $185,400 |
| 2014 | $2,730 | $250,600 | $68,000 | $182,600 |
| 2013 | $2,730 | $229,700 | $69,700 | $160,000 |
Source: Public Records
Map
Nearby Homes
- 1607 Kincaid St Unit E-8
- 1856 Spencer Ct Unit 12F
- 2176 McDonald Ave
- 2147 Hammond Ave Unit B10
- 1680 Kennedy Place Unit A4
- 2176 Palisade Blvd Unit F-3
- 2237 Tolmie St
- 1975 Garry Oaks Ave Unit C
- 2055 Garry Oaks Ave Unit B
- 1331 Rowan Ct Unit 1331
- 1373 Hudson St Unit 1373
- 605 Louviers Ave
- 1285 Griggs St
- 504 Dupont Ave
- 1263 Hudson St
- 2699 Erwin Ave Unit 2699
- 403 Louviers Ave
- 2420 Simmons St Unit B
- 205 Brandywine Ave
- 3114 Walker Rd
- 2049 McDonald Ave
- 2013 McDonald Ave
- 2061 McDonald Ave
- 1965 McDonald Ave
- 2073 McDonald Ave
- 1959 McDonald Ave
- 2085 McDonald Ave
- 2060 McDonald Ave
- 2088 McDonald Ave
- 2068 McDonald Ave
- 1976 McDonald Ave
- 2084 McDonald Ave
- 2072 McDonald Ave
- 1970 McDonald Ave
- 2080 McDonald Ave
- 1964 McDonald Ave
- 1947 McDonald Ave
- 2076 McDonald Ave
- 1958 McDonald Ave
- 1452 Rooklidge St