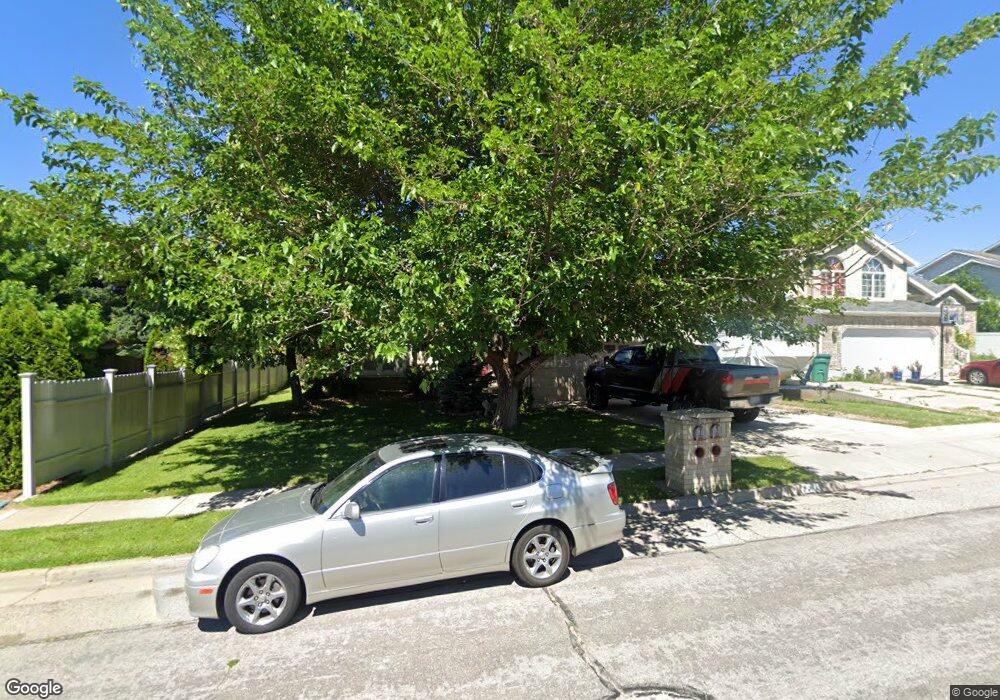
2037 N 650 W Layton, UT 84041
Estimated Value: $464,000 - $526,000
4
Beds
3
Baths
2,271
Sq Ft
$221/Sq Ft
Est. Value
About This Home
This home is located at 2037 N 650 W, Layton, UT 84041 and is currently estimated at $500,808, approximately $220 per square foot. 2037 N 650 W is a home located in Davis County with nearby schools including Lincoln Elementary School, North Layton Junior High School, and Northridge High School.
Ownership History
Date
Name
Owned For
Owner Type
Purchase Details
Closed on
Dec 24, 2009
Sold by
Pham Sang V
Bought by
Vanpham Sang
Current Estimated Value
Home Financials for this Owner
Home Financials are based on the most recent Mortgage that was taken out on this home.
Original Mortgage
$218,095
Outstanding Balance
$141,375
Interest Rate
4.78%
Mortgage Type
FHA
Estimated Equity
$359,433
Purchase Details
Closed on
May 14, 2008
Sold by
Johnson Desiree I
Bought by
Pham Sang
Home Financials for this Owner
Home Financials are based on the most recent Mortgage that was taken out on this home.
Original Mortgage
$219,554
Interest Rate
5.88%
Mortgage Type
FHA
Purchase Details
Closed on
Feb 6, 2003
Sold by
Hodge Rodney A and Hodge Lisa A
Bought by
Johnson Desiree I
Home Financials for this Owner
Home Financials are based on the most recent Mortgage that was taken out on this home.
Original Mortgage
$168,198
Interest Rate
5.83%
Mortgage Type
VA
Create a Home Valuation Report for This Property
The Home Valuation Report is an in-depth analysis detailing your home's value as well as a comparison with similar homes in the area
Home Values in the Area
Average Home Value in this Area
Purchase History
| Date | Buyer | Sale Price | Title Company |
|---|---|---|---|
| Vanpham Sang | -- | Bonneville Superior Title Co | |
| Pham Sang | -- | First American Title | |
| Johnson Desiree I | -- | Title West Title Company |
Source: Public Records
Mortgage History
| Date | Status | Borrower | Loan Amount |
|---|---|---|---|
| Open | Vanpham Sang | $218,095 | |
| Closed | Pham Sang | $219,554 | |
| Previous Owner | Johnson Desiree I | $168,198 |
Source: Public Records
Tax History Compared to Growth
Tax History
| Year | Tax Paid | Tax Assessment Tax Assessment Total Assessment is a certain percentage of the fair market value that is determined by local assessors to be the total taxable value of land and additions on the property. | Land | Improvement |
|---|---|---|---|---|
| 2024 | $2,211 | $233,750 | $109,211 | $124,539 |
| 2023 | $2,210 | $412,000 | $134,584 | $277,416 |
| 2022 | $2,320 | $234,850 | $69,730 | $165,120 |
| 2021 | $2,193 | $331,000 | $94,144 | $236,856 |
| 2020 | $1,989 | $288,000 | $80,744 | $207,256 |
| 2019 | $1,932 | $274,000 | $78,106 | $195,894 |
| 2018 | $1,742 | $248,000 | $78,106 | $169,894 |
| 2016 | $1,659 | $121,880 | $23,957 | $97,923 |
| 2015 | $1,576 | $109,890 | $23,957 | $85,933 |
| 2014 | $1,600 | $114,057 | $23,957 | $90,100 |
| 2013 | -- | $101,524 | $22,179 | $79,345 |
Source: Public Records
Map
Nearby Homes
- 781 W 2150 N
- 2211 N 525 W
- 2187 N 450 W
- 1837 N 440 W
- 2378 N 675 W
- 2402 N 725 W
- 1676 Forbes Ave W
- 247 W 1925 N
- 2048 Evans Cove Loop
- 2044 Evans Cove Loop
- 1966 N 50 W
- 1094 N Angel St W
- 2600 N Hill Field Rd Unit 4
- 2600 N Hill Field Rd Unit 138
- 1500 N Angel St Unit 12
- 1500 N Angel St Unit 64
- 1500 N Angel St Unit 22
- 23 E 2150 N
- 1644 N 160 W
- 2500 N Fort Ln Unit 238