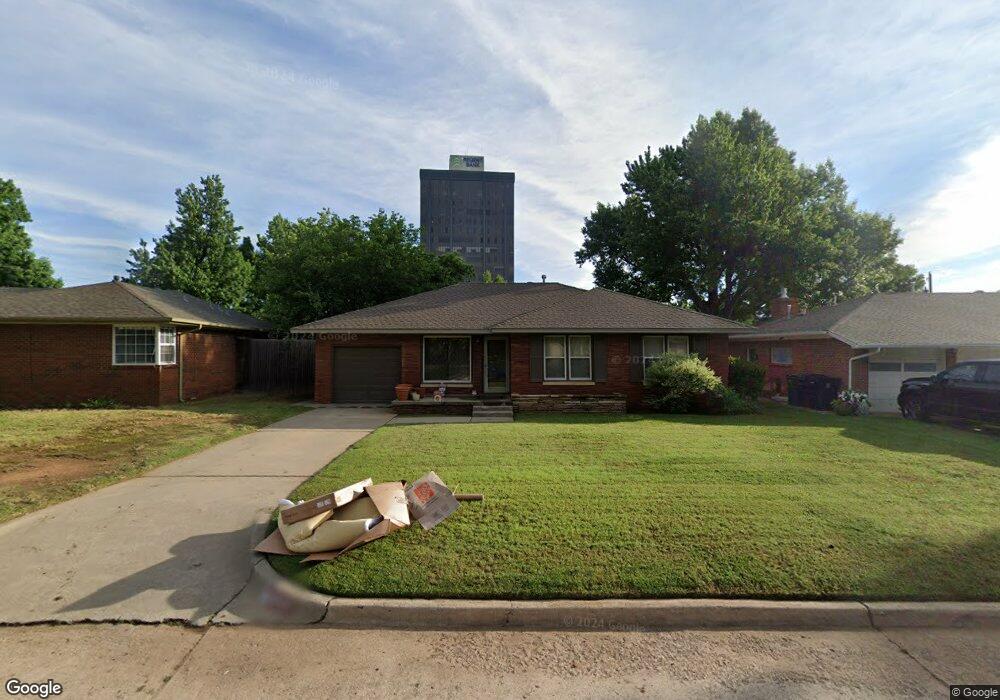
2037 NW 48th St Oklahoma City, OK 73118
Woodland Park NeighborhoodEstimated Value: $219,320 - $232,000
3
Beds
2
Baths
1,385
Sq Ft
$162/Sq Ft
Est. Value
About This Home
This home is located at 2037 NW 48th St, Oklahoma City, OK 73118 and is currently estimated at $224,580, approximately $162 per square foot. 2037 NW 48th St is a home located in Oklahoma County with nearby schools including John Marshall Middle School, John Marshall High School, and Epic Blended Charter Okc Elementary, Middle & High School.
Ownership History
Date
Name
Owned For
Owner Type
Purchase Details
Closed on
May 14, 2012
Sold by
Spielmann Greg and Spielmann Johanna
Bought by
Dominator Properties Inc
Current Estimated Value
Purchase Details
Closed on
Oct 15, 2010
Sold by
Secretary Of Housing & Urban Development
Bought by
Spielmann Greg
Purchase Details
Closed on
Jun 17, 2010
Sold by
Cooper Catherine S
Bought by
Secretary Of Housing & Urban Development
Purchase Details
Closed on
Oct 24, 2005
Sold by
Luther Tyoga J and Luther Kimberly Jo
Bought by
Cooper Catherine S
Home Financials for this Owner
Home Financials are based on the most recent Mortgage that was taken out on this home.
Original Mortgage
$113,601
Interest Rate
5.9%
Mortgage Type
FHA
Purchase Details
Closed on
Apr 7, 2000
Sold by
Luther Kimberly J and Benson Kimberly J
Bought by
Luther Tyoga J and Luther Kimberly Jo
Create a Home Valuation Report for This Property
The Home Valuation Report is an in-depth analysis detailing your home's value as well as a comparison with similar homes in the area
Home Values in the Area
Average Home Value in this Area
Purchase History
| Date | Buyer | Sale Price | Title Company |
|---|---|---|---|
| Dominator Properties Inc | -- | The Oklahoma City Abstract & | |
| Spielmann Greg | -- | Heartland Title & Closing Ll | |
| Secretary Of Housing & Urban Development | -- | None Available | |
| Cooper Catherine S | $114,500 | Stewart Abstract & Title Of | |
| Luther Tyoga J | -- | Stewart Abstract & Title Of | |
| Luther Tyoga J | -- | -- |
Source: Public Records
Mortgage History
| Date | Status | Borrower | Loan Amount |
|---|---|---|---|
| Previous Owner | Cooper Catherine S | $113,601 |
Source: Public Records
Tax History Compared to Growth
Tax History
| Year | Tax Paid | Tax Assessment Tax Assessment Total Assessment is a certain percentage of the fair market value that is determined by local assessors to be the total taxable value of land and additions on the property. | Land | Improvement |
|---|---|---|---|---|
| 2024 | $2,229 | $19,052 | $4,199 | $14,853 |
| 2023 | $2,229 | $18,145 | $2,720 | $15,425 |
| 2022 | $2,033 | $17,280 | $2,920 | $14,360 |
| 2021 | $1,937 | $16,458 | $2,942 | $13,516 |
| 2020 | $1,867 | $15,675 | $3,067 | $12,608 |
| 2019 | $1,787 | $15,015 | $2,917 | $12,098 |
| 2018 | $1,622 | $14,300 | $0 | $0 |
| 2017 | $1,560 | $13,765 | $2,998 | $10,767 |
| 2016 | $1,487 | $13,110 | $2,936 | $10,174 |
| 2015 | $1,430 | $12,486 | $2,619 | $9,867 |
| 2014 | $1,354 | $11,892 | $2,617 | $9,275 |
Source: Public Records
Map
Nearby Homes
- 2029 NW 47th St
- 4400 Hemingway Dr Unit 265
- 4400 Hemingway Dr Unit 245
- 2202 NW 45th St
- 4319 N Indiana Ave
- 0 054857452 Unit 1195188
- 4311 N Georgia Ave
- 2325 NW 47th St
- 1609 NW 43rd St
- 2329 NW 47th St
- 2009 NW 40th St
- 1509 NW 45th St
- 1527 NW 43rd St
- 4501 N Billen Ave
- 1731 NW 40th St
- 1500 NW 45th St
- 4511 N Mckinley Ave
- 2401 NW 43rd Cir
- 4812 N Villa Ave
- 2225 Dawn Marie Dr
- 2033 NW 48th St
- 2041 NW 48th St
- 2045 NW 48th St
- 2029 NW 48th St
- 2044 Mattern Dr
- 2040 Mattern Dr
- 2048 Mattern Dr
- 2036 Mattern Dr
- 2036 NW 48th St
- 2052 Mattern Dr
- 2049 NW 48th St
- 2040 NW 48th St
- 2032 NW 48th St
- 2025 NW 48th St
- 2032 Mattern Dr
- 2044 NW 48th St
- 2056 Mattern Dr
- 2028 NW 48th St
- 2053 NW 48th St