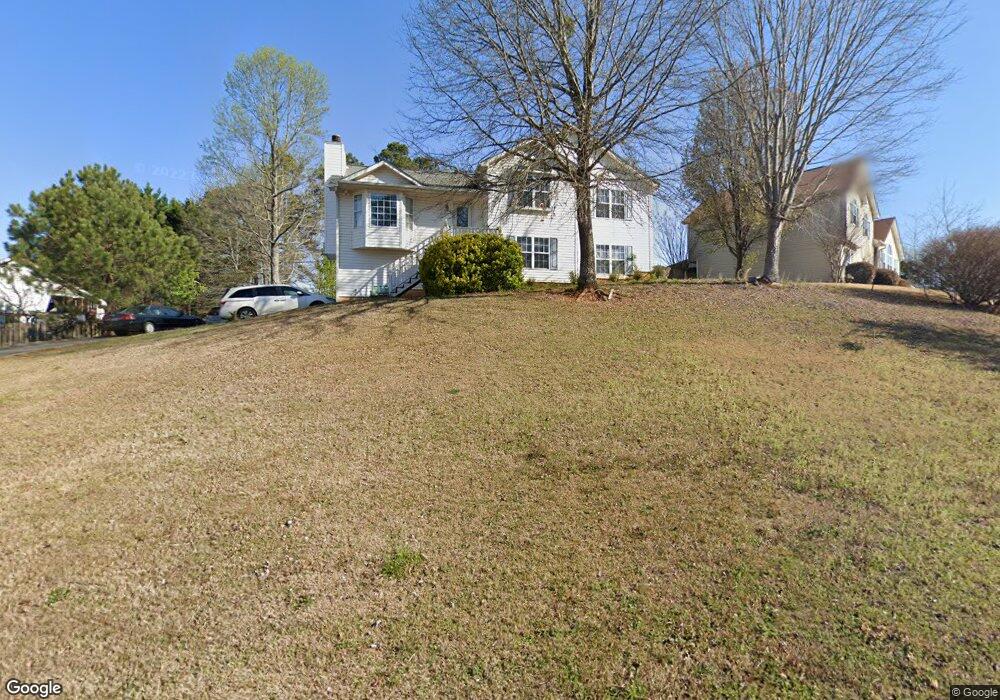
2037 Queensbury Dr Unit 3 Acworth, GA 30102
Oak Grove NeighborhoodEstimated Value: $387,000 - $393,499
3
Beds
2
Baths
2,112
Sq Ft
$185/Sq Ft
Est. Value
About This Home
This home is located at 2037 Queensbury Dr Unit 3, Acworth, GA 30102 and is currently estimated at $390,250, approximately $184 per square foot. 2037 Queensbury Dr Unit 3 is a home located in Cherokee County with nearby schools including Oak Grove Elementary School, E. T. Booth Middle School, and Etowah High School.
Ownership History
Date
Name
Owned For
Owner Type
Purchase Details
Closed on
Aug 26, 2020
Sold by
Beebe Benajmin Albert
Bought by
Beebe Benajmin Albert and Beebe Kaitlyn Sheree
Current Estimated Value
Home Financials for this Owner
Home Financials are based on the most recent Mortgage that was taken out on this home.
Original Mortgage
$206,150
Outstanding Balance
$182,112
Interest Rate
2.9%
Mortgage Type
New Conventional
Estimated Equity
$208,138
Purchase Details
Closed on
Oct 29, 1998
Sold by
Dixie Developing & Building Inc
Bought by
Loeffler William and Loeffler Tamela L
Home Financials for this Owner
Home Financials are based on the most recent Mortgage that was taken out on this home.
Original Mortgage
$133,797
Interest Rate
6.65%
Create a Home Valuation Report for This Property
The Home Valuation Report is an in-depth analysis detailing your home's value as well as a comparison with similar homes in the area
Home Values in the Area
Average Home Value in this Area
Purchase History
| Date | Buyer | Sale Price | Title Company |
|---|---|---|---|
| Beebe Benajmin Albert | -- | -- | |
| Beebe Benjamin Albert | $217,000 | -- | |
| Loeffler William | $129,900 | -- |
Source: Public Records
Mortgage History
| Date | Status | Borrower | Loan Amount |
|---|---|---|---|
| Open | Beebe Benjamin Albert | $206,150 | |
| Closed | Beebe Benajmin Albert | $206,150 | |
| Previous Owner | Loeffler William | $133,797 |
Source: Public Records
Tax History Compared to Growth
Tax History
| Year | Tax Paid | Tax Assessment Tax Assessment Total Assessment is a certain percentage of the fair market value that is determined by local assessors to be the total taxable value of land and additions on the property. | Land | Improvement |
|---|---|---|---|---|
| 2025 | $3,890 | $148,112 | $32,000 | $116,112 |
| 2024 | $3,636 | $139,920 | $28,000 | $111,920 |
| 2023 | $3,698 | $142,320 | $28,000 | $114,320 |
| 2022 | $2,708 | $103,040 | $18,800 | $84,240 |
| 2021 | $2,464 | $86,800 | $18,386 | $68,414 |
| 2020 | $2,369 | $83,360 | $17,600 | $65,760 |
| 2019 | $2,169 | $76,320 | $17,600 | $58,720 |
| 2018 | $1,869 | $65,360 | $14,400 | $50,960 |
| 2017 | $1,703 | $161,500 | $14,400 | $50,200 |
| 2016 | $1,703 | $146,200 | $14,400 | $44,080 |
| 2015 | $1,744 | $148,300 | $14,400 | $44,920 |
| 2014 | $1,684 | $142,900 | $13,760 | $43,400 |
Source: Public Records
Map
Nearby Homes
- 341 Brighton Bend Ln
- 337 Brighton Bend Ln
- 756 Coventry Cove Way
- 752 Coventry Cove Way
- 307 Queensbury Walk
- 222 Gallant Fox Way
- The Fenton Plan at Buice Lake - Madison
- The Davis Plan at Buice Lake - Madison
- 1216 Marlo Way
- 302 Victory Commons Overlook
- 3094 Cambridge Mill St
- 3070 Cambridge Mill St
- 849 York Alley
- 544 Aberdeen Meadow Ln
- 3086 Cambridge Mill St
- 648 Devon Alley
- 3061 Cambridge Mill St
- 3098 Cambridge Mill St
- 6390 Woodstock Rd
- 148 Sable Trace Trail
- 2039 Queensbury Dr Unit 3
- 2035 Queensbury Dr
- 2033 Queensbury Dr
- 2041 Queensbury Dr Unit 3
- 2036 Queensbury Dr Unit 3
- 2038 Queensbury Dr
- 2043 Queensbury Dr
- 502 Queensbury Way Unit 2
- 2034 Queensbury Dr Unit 3
- 2040 Queensbury Dr Unit 3
- 1056 Queensbury Run
- 500 Queensbury Way
- 504 Queensbury Way Unit 2
- 2042 Queensbury Dr
- 2044 Queensbury Dr
- 2047 Queensbury Dr Unit 3
- 2046 Queensbury Dr Unit 3
- 2048 Queensbury Dr Unit 3
- 1049 Queensbury Run Unit 2
- 506 Queensbury Way Unit 2