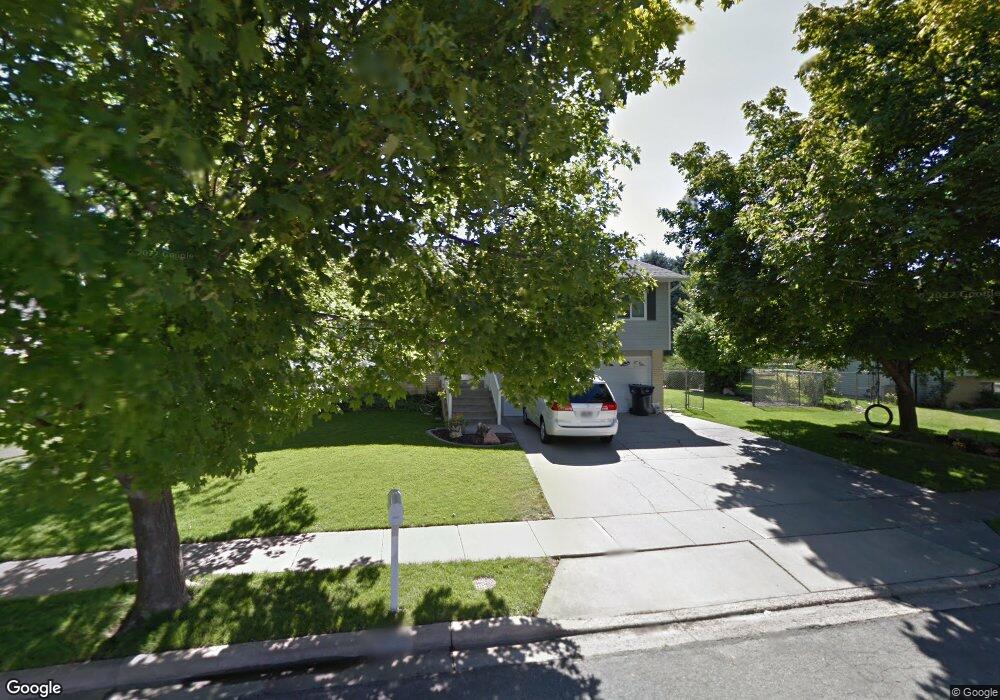
2037 S 865 W Woods Cross, UT 84087
Estimated Value: $441,000 - $511,000
3
Beds
2
Baths
1,154
Sq Ft
$418/Sq Ft
Est. Value
About This Home
This home is located at 2037 S 865 W, Woods Cross, UT 84087 and is currently estimated at $482,084, approximately $417 per square foot. 2037 S 865 W is a home located in Davis County with nearby schools including Woods Cross Elementary School, South Davis Junior High School, and Woods Cross High School.
Ownership History
Date
Name
Owned For
Owner Type
Purchase Details
Closed on
Sep 12, 2012
Sold by
Drommond Cameron J and Drommond Annie
Bought by
Drommond Cameron J and Drommond Annie L
Current Estimated Value
Home Financials for this Owner
Home Financials are based on the most recent Mortgage that was taken out on this home.
Original Mortgage
$143,600
Outstanding Balance
$98,681
Interest Rate
3.5%
Mortgage Type
New Conventional
Estimated Equity
$383,403
Purchase Details
Closed on
Jun 12, 2007
Sold by
Flygare Gordon Savage and Flygare Susan W
Bought by
Drommond Cameron J and Drommond Annie
Home Financials for this Owner
Home Financials are based on the most recent Mortgage that was taken out on this home.
Original Mortgage
$158,600
Interest Rate
6.14%
Mortgage Type
Purchase Money Mortgage
Create a Home Valuation Report for This Property
The Home Valuation Report is an in-depth analysis detailing your home's value as well as a comparison with similar homes in the area
Home Values in the Area
Average Home Value in this Area
Purchase History
| Date | Buyer | Sale Price | Title Company |
|---|---|---|---|
| Drommond Cameron J | -- | Us Title Company Of | |
| Drommond Cameron J | -- | Backman Title Services |
Source: Public Records
Mortgage History
| Date | Status | Borrower | Loan Amount |
|---|---|---|---|
| Open | Drommond Cameron J | $143,600 | |
| Closed | Drommond Cameron J | $158,600 |
Source: Public Records
Tax History Compared to Growth
Tax History
| Year | Tax Paid | Tax Assessment Tax Assessment Total Assessment is a certain percentage of the fair market value that is determined by local assessors to be the total taxable value of land and additions on the property. | Land | Improvement |
|---|---|---|---|---|
| 2025 | $2,666 | $233,200 | $113,369 | $119,831 |
| 2024 | $2,566 | $229,899 | $121,212 | $108,687 |
| 2023 | $2,427 | $222,200 | $88,480 | $133,719 |
| 2022 | $2,405 | $404,000 | $127,091 | $276,909 |
| 2021 | $2,169 | $319,000 | $102,699 | $216,301 |
| 2020 | $1,931 | $281,000 | $97,789 | $183,211 |
| 2019 | $1,913 | $274,000 | $91,108 | $182,892 |
| 2018 | $1,772 | $252,000 | $89,565 | $162,435 |
| 2016 | $1,478 | $114,290 | $38,596 | $75,694 |
| 2015 | $1,401 | $104,390 | $38,596 | $65,794 |
| 2014 | $1,486 | $114,171 | $38,596 | $75,575 |
| 2013 | -- | $101,676 | $24,798 | $76,878 |
Source: Public Records
Map
Nearby Homes