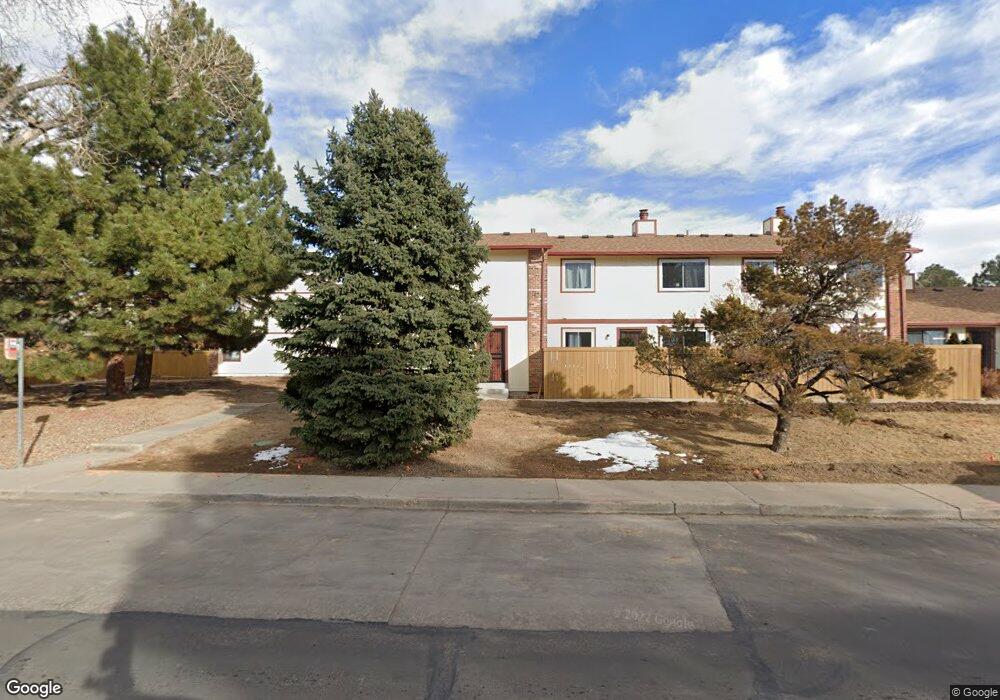
2037 W 102nd Ave Thornton, CO 80260
Estimated Value: $310,000 - $331,000
2
Beds
1
Bath
1,073
Sq Ft
$297/Sq Ft
Est. Value
About This Home
This home is located at 2037 W 102nd Ave, Thornton, CO 80260 and is currently estimated at $318,233, approximately $296 per square foot. 2037 W 102nd Ave is a home located in Adams County with nearby schools including Hillcrest Elementary School, Silver Hills Middle School, and Northglenn High School.
Ownership History
Date
Name
Owned For
Owner Type
Purchase Details
Closed on
Jul 22, 2004
Sold by
Laursen Timothy William
Bought by
Laursen Timothy William and Laursen Daleen
Current Estimated Value
Home Financials for this Owner
Home Financials are based on the most recent Mortgage that was taken out on this home.
Original Mortgage
$144,900
Outstanding Balance
$78,358
Interest Rate
7.5%
Mortgage Type
Unknown
Estimated Equity
$239,875
Purchase Details
Closed on
Sep 29, 1995
Sold by
Paik Kwan Il
Bought by
Laursen Timothy William
Home Financials for this Owner
Home Financials are based on the most recent Mortgage that was taken out on this home.
Original Mortgage
$80,624
Interest Rate
7%
Mortgage Type
FHA
Create a Home Valuation Report for This Property
The Home Valuation Report is an in-depth analysis detailing your home's value as well as a comparison with similar homes in the area
Home Values in the Area
Average Home Value in this Area
Purchase History
| Date | Buyer | Sale Price | Title Company |
|---|---|---|---|
| Laursen Timothy William | -- | Fahtco | |
| Laursen Timothy William | $80,950 | -- |
Source: Public Records
Mortgage History
| Date | Status | Borrower | Loan Amount |
|---|---|---|---|
| Open | Laursen Timothy William | $144,900 | |
| Closed | Laursen Timothy William | $80,624 | |
| Closed | Laursen Timothy William | $36,225 |
Source: Public Records
Tax History Compared to Growth
Tax History
| Year | Tax Paid | Tax Assessment Tax Assessment Total Assessment is a certain percentage of the fair market value that is determined by local assessors to be the total taxable value of land and additions on the property. | Land | Improvement |
|---|---|---|---|---|
| 2024 | $1,365 | $20,620 | $4,560 | $16,060 |
| 2023 | $1,353 | $23,070 | $3,520 | $19,550 |
| 2022 | $1,191 | $17,280 | $3,610 | $13,670 |
| 2021 | $1,231 | $17,280 | $3,610 | $13,670 |
| 2020 | $1,054 | $16,180 | $3,720 | $12,460 |
| 2019 | $1,056 | $16,180 | $3,720 | $12,460 |
| 2018 | $805 | $13,360 | $1,440 | $11,920 |
| 2017 | $733 | $13,360 | $1,440 | $11,920 |
| 2016 | $587 | $10,420 | $1,590 | $8,830 |
| 2015 | $587 | $5,220 | $800 | $4,420 |
| 2014 | $502 | $4,340 | $800 | $3,540 |
Source: Public Records
Map
Nearby Homes
- 2025 W 102nd Ave
- 2029 W 102nd Ave
- 1945 W 102nd Ave
- 1935 W 102nd Ave
- 2123 W 101st Cir
- 2012 W 101st Ave
- 1923 W 101st Ave
- 10072 Wyandott Cir S
- 10143 Quivas St
- 1707 W 102nd Ave
- 10211 Ura Ln Unit 4-107
- 10211 Ura Ln Unit 204
- 10211 Ura Ln Unit 5-206
- 10211 Ura Ln Unit 6-307
- 10211 Ura Ln Unit 7-108
- 10211 Ura Ln Unit 104
- 10211 Ura Ln Unit 101
- 10211 Ura Ln Unit 7-204
- 10211 Ura Ln Unit 8-207
- 10204 Quivas St
- 2039 W 102nd Ave
- 2041 W 102nd Ave
- 2035 W 102nd Ave
- 2033 W 102nd Ave
- 2023 W 102nd Ave
- 2031 W 102nd Ave
- 2043 W 102nd Ave
- 2027 W 102nd Ave
- 2013 W 102nd Ave
- 2013 W 102nd Ave Unit A
- 2111 W 101st Cir
- 2103 W 101st Cir
- 2105 W 101st Cir
- 2019 W 102nd Ave
- 2011 W 102nd Ave
- 2101 W 101st Cir
- 1947 W 102nd Ave
- 2017 W 102nd Ave
- 2015 W 102nd Ave
- 2009 W 102nd Ave