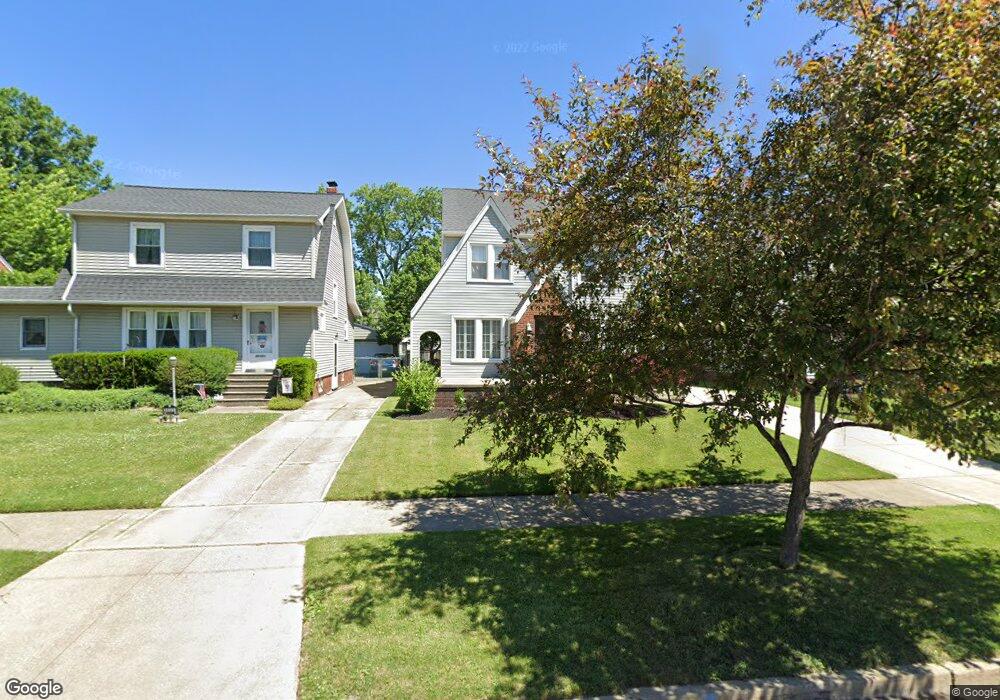
20371 S Lake Shore Blvd Euclid, OH 44123
Estimated Value: $128,023 - $186,000
2
Beds
1
Bath
1,184
Sq Ft
$123/Sq Ft
Est. Value
About This Home
This home is located at 20371 S Lake Shore Blvd, Euclid, OH 44123 and is currently estimated at $145,756, approximately $123 per square foot. 20371 S Lake Shore Blvd is a home located in Cuyahoga County with nearby schools including Arbor Elementary School, Euclid Middle School, and Euclid High School.
Ownership History
Date
Name
Owned For
Owner Type
Purchase Details
Closed on
Jan 13, 2005
Sold by
Rendina Suzette M
Bought by
Hetman Russell E
Current Estimated Value
Home Financials for this Owner
Home Financials are based on the most recent Mortgage that was taken out on this home.
Original Mortgage
$82,400
Outstanding Balance
$42,014
Interest Rate
5.9%
Mortgage Type
Purchase Money Mortgage
Estimated Equity
$103,742
Purchase Details
Closed on
Feb 2, 1990
Sold by
Schiller Olga
Bought by
Rendina Anthony
Purchase Details
Closed on
Apr 27, 1976
Sold by
Schiller Olga
Bought by
Schiller Olga
Purchase Details
Closed on
Apr 26, 1976
Sold by
Schiller Olga
Bought by
Schiller Olga
Purchase Details
Closed on
Jan 1, 1975
Bought by
Schiller Olga
Create a Home Valuation Report for This Property
The Home Valuation Report is an in-depth analysis detailing your home's value as well as a comparison with similar homes in the area
Home Values in the Area
Average Home Value in this Area
Purchase History
| Date | Buyer | Sale Price | Title Company |
|---|---|---|---|
| Hetman Russell E | $103,000 | City Title Agency | |
| Rendina Anthony | $51,900 | -- | |
| Schiller Olga | -- | -- | |
| Schiller Olga | -- | -- | |
| Schiller Olga | -- | -- |
Source: Public Records
Mortgage History
| Date | Status | Borrower | Loan Amount |
|---|---|---|---|
| Open | Hetman Russell E | $82,400 | |
| Closed | Hetman Russell E | $20,600 |
Source: Public Records
Tax History Compared to Growth
Tax History
| Year | Tax Paid | Tax Assessment Tax Assessment Total Assessment is a certain percentage of the fair market value that is determined by local assessors to be the total taxable value of land and additions on the property. | Land | Improvement |
|---|---|---|---|---|
| 2024 | $3,122 | $45,325 | $9,170 | $36,155 |
| 2023 | $2,758 | $30,880 | $6,620 | $24,260 |
| 2022 | $2,621 | $30,870 | $6,620 | $24,260 |
| 2021 | $2,921 | $30,870 | $6,620 | $24,260 |
| 2020 | $2,964 | $28,600 | $6,130 | $22,470 |
| 2019 | $2,665 | $81,700 | $17,500 | $64,200 |
| 2018 | $2,691 | $28,600 | $6,130 | $22,470 |
| 2017 | $2,856 | $25,380 | $5,110 | $20,270 |
| 2016 | $2,863 | $25,380 | $5,110 | $20,270 |
| 2015 | $2,606 | $25,380 | $5,110 | $20,270 |
| 2014 | $2,606 | $25,380 | $5,110 | $20,270 |
Source: Public Records
Map
Nearby Homes
- 20330 S Lake Shore Blvd
- 275 E 200th St
- 20207 Lake Shore Blvd
- 20249 Lake Shore Blvd
- 174 E 200th St
- 273 E 208th St
- 19751 Lake Shore Blvd
- 21051 S Lake Shore Blvd
- 311 E 197th St
- 21030 Priday Ave
- 20561 Westport Ave
- 121 E 205th St
- 21251 S Lake Shore Blvd
- 20921 Westport Ave
- 20760 Westport Ave
- 362 E 214th St
- 144 E 208th St
- 20671 Wilmore Ave
- 21181 Ball Ave
- 21051 Westport Ave
- 20351 S Lake Shore Blvd
- 20381 S Lake Shore Blvd
- 20381 S Lake Shore
- 20391 S Lake Shore Blvd
- 20331 S Lake Shore Blvd
- 20330 Ardwell Dr
- 20350 Ardwell Dr
- 20300 Ardwell Dr
- 20301 S Lake Shore Blvd
- 20270 Ardwell Dr
- 20390 Ardwell Dr
- 20250 Ardwell Dr
- 20370 S Lake Shore Blvd
- 20380 S Lake Shore Blvd
- 20271 S Lake Shore Blvd
- 20350 S Lake Shore Blvd
- 20390 S Lake Shore Blvd
- 20501 S Lake Shore Blvd
- 20220 Ardwell Dr
- 20400 S Lake Shore Blvd