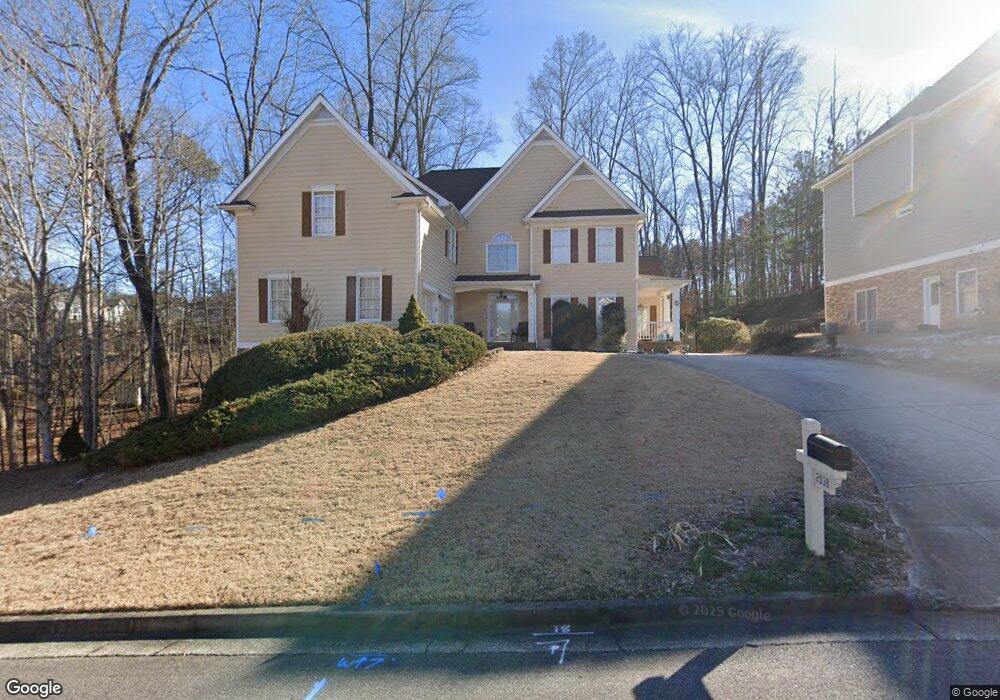
2038 Haydenbrook Dr NW Acworth, GA 30101
Estimated Value: $573,570 - $674,000
4
Beds
4
Baths
3,736
Sq Ft
$171/Sq Ft
Est. Value
About This Home
This home is located at 2038 Haydenbrook Dr NW, Acworth, GA 30101 and is currently estimated at $639,893, approximately $171 per square foot. 2038 Haydenbrook Dr NW is a home located in Cobb County with nearby schools including Pickett's Mill Elementary School, Durham Middle School, and Allatoona High School.
Ownership History
Date
Name
Owned For
Owner Type
Purchase Details
Closed on
Mar 8, 2021
Sold by
Hayden Larry Bruce
Bought by
Hayden Jeannine
Current Estimated Value
Purchase Details
Closed on
Nov 18, 2011
Sold by
Federal National Mortgage Association
Bought by
Hayden Larry B and Hayden Jeannine
Home Financials for this Owner
Home Financials are based on the most recent Mortgage that was taken out on this home.
Original Mortgage
$228,944
Outstanding Balance
$154,068
Interest Rate
3.75%
Mortgage Type
FHA
Estimated Equity
$485,825
Purchase Details
Closed on
Jan 4, 2011
Sold by
Citimortgage
Bought by
Federal Natl Mtg Assn Fnma
Purchase Details
Closed on
Dec 23, 2003
Sold by
Bo Walker Inc
Bought by
Arrington Terry D
Home Financials for this Owner
Home Financials are based on the most recent Mortgage that was taken out on this home.
Original Mortgage
$240,800
Interest Rate
5.5%
Mortgage Type
New Conventional
Create a Home Valuation Report for This Property
The Home Valuation Report is an in-depth analysis detailing your home's value as well as a comparison with similar homes in the area
Home Values in the Area
Average Home Value in this Area
Purchase History
| Date | Buyer | Sale Price | Title Company |
|---|---|---|---|
| Hayden Jeannine | -- | None Available | |
| Hayden Larry B | $234,900 | -- | |
| Federal Natl Mtg Assn Fnma | -- | -- | |
| Citimortgage | $267,000 | -- | |
| Arrington Terry D | $301,000 | -- |
Source: Public Records
Mortgage History
| Date | Status | Borrower | Loan Amount |
|---|---|---|---|
| Open | Hayden Larry B | $228,944 | |
| Previous Owner | Arrington Terry D | $240,800 |
Source: Public Records
Tax History Compared to Growth
Tax History
| Year | Tax Paid | Tax Assessment Tax Assessment Total Assessment is a certain percentage of the fair market value that is determined by local assessors to be the total taxable value of land and additions on the property. | Land | Improvement |
|---|---|---|---|---|
| 2024 | $1,592 | $235,212 | $56,000 | $179,212 |
| 2023 | $1,208 | $175,792 | $42,000 | $133,792 |
| 2022 | $4,548 | $175,792 | $42,000 | $133,792 |
| 2021 | $3,929 | $147,548 | $38,000 | $109,548 |
| 2020 | $4,145 | $157,392 | $30,000 | $127,392 |
| 2019 | $4,145 | $157,392 | $30,000 | $127,392 |
| 2018 | $3,571 | $131,176 | $30,000 | $101,176 |
| 2017 | $3,406 | $131,176 | $30,000 | $101,176 |
| 2016 | $3,290 | $125,808 | $28,800 | $97,008 |
| 2015 | $3,369 | $125,808 | $28,800 | $97,008 |
| 2014 | $3,396 | $125,808 | $0 | $0 |
Source: Public Records
Map
Nearby Homes
- 5116 Barton Pass NW
- 5153 Elkins Ln NW
- 5090 Newpark Dr NW
- 1963 Heatherbrooke Ln NW
- 5362 Manor View Dr NW Unit 12
- 4980 Pleasantry Way NW
- 2316 Fripp Overlook NW
- 5105 Dillingham Dr NW
- 5087 Dillingham Dr NW
- 4980 Newpark Ln NW Unit 2
- 4973 Newpark Ln NW
- 4902 Pleasantry Way NW
- 5485 Brookstone Dr NW
- 1812 Mountain Lake Dr NW
- 5046 Sunbrook Dr NW
- 2009 Mclain Rd NW
- 2045 Mclain Rd NW Unit 2
- 2036 Haydenbrook Dr NW
- 2040 Haydenbrook Dr NW Unit 23
- 2039 Haydenbrook Dr NW
- 0 Haydenbrook Dr NW Unit 7534241
- 0 Haydenbrook Dr NW Unit 7347506
- 0 Haydenbrook Dr NW Unit 7305902
- 0 Haydenbrook Dr NW Unit 7274713
- 0 Haydenbrook Dr NW Unit 7272357
- 0 Haydenbrook Dr NW Unit 7230392
- 0 Haydenbrook Dr NW Unit 7162057
- 0 Haydenbrook Dr NW Unit 7077173
- 0 Haydenbrook Dr NW Unit 3249667
- 0 Haydenbrook Dr NW Unit 3165294
- 0 Haydenbrook Dr NW Unit 8538546
- 0 Haydenbrook Dr NW Unit 8149002
- 0 Haydenbrook Dr NW Unit 8127887
- 0 Haydenbrook Dr NW Unit 8048570
- 0 Haydenbrook Dr NW Unit 8041135
- 0 Haydenbrook Dr NW Unit 8007801
- 0 Haydenbrook Dr NW Unit 7599183