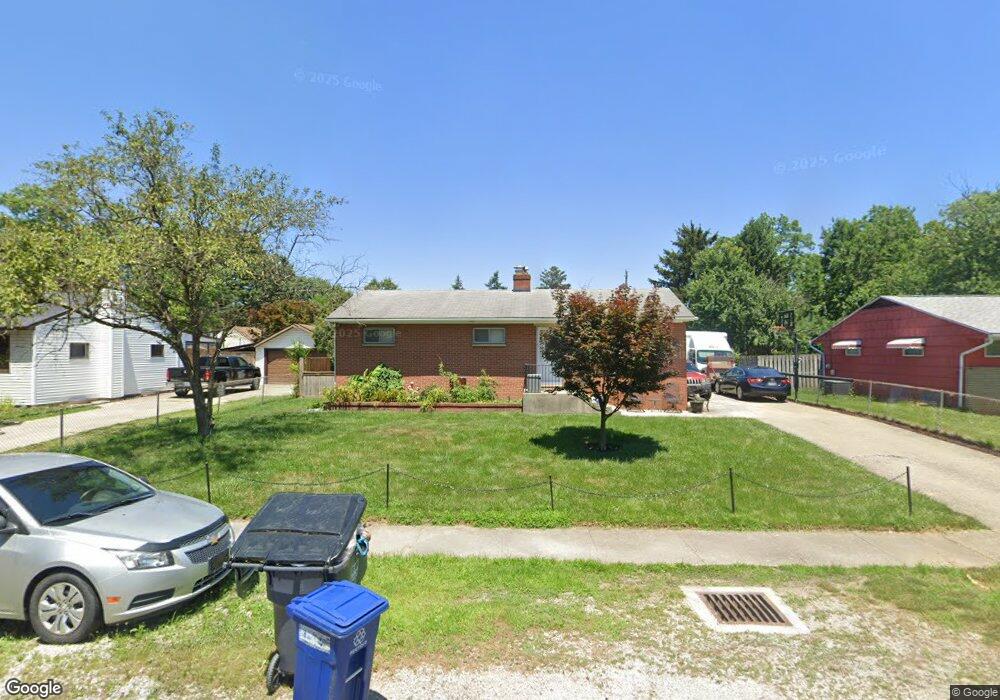
2038 Radnor Ave Columbus, OH 43224
North Linden NeighborhoodEstimated Value: $166,000 - $260,000
3
Beds
2
Baths
1,652
Sq Ft
$137/Sq Ft
Est. Value
About This Home
This home is located at 2038 Radnor Ave, Columbus, OH 43224 and is currently estimated at $226,879, approximately $137 per square foot. 2038 Radnor Ave is a home located in Franklin County with nearby schools including North Linden Elementary School, Medina Middle School, and Mifflin High School.
Ownership History
Date
Name
Owned For
Owner Type
Purchase Details
Closed on
Sep 24, 2004
Sold by
Moore Charles and Moore Delorse D
Bought by
Lugo Adam and Hatfield Lisa A
Current Estimated Value
Home Financials for this Owner
Home Financials are based on the most recent Mortgage that was taken out on this home.
Original Mortgage
$99,000
Outstanding Balance
$49,555
Interest Rate
5.93%
Mortgage Type
Purchase Money Mortgage
Estimated Equity
$177,324
Purchase Details
Closed on
Sep 23, 2004
Sold by
Moore Little Tabitha M and Estate Of Paul F Moore
Bought by
Lugo Adam and Hatfield Lisa A
Home Financials for this Owner
Home Financials are based on the most recent Mortgage that was taken out on this home.
Original Mortgage
$99,000
Outstanding Balance
$49,555
Interest Rate
5.93%
Mortgage Type
Purchase Money Mortgage
Estimated Equity
$177,324
Purchase Details
Closed on
Sep 12, 2002
Sold by
Estate Of Paul J Moore
Bought by
Moore Paul F and Moore Charles
Purchase Details
Closed on
Sep 4, 2002
Sold by
Estate Of Virginia G Moore
Bought by
Moore Paul J
Purchase Details
Closed on
Jun 24, 1965
Bought by
Roberts Virginia G
Create a Home Valuation Report for This Property
The Home Valuation Report is an in-depth analysis detailing your home's value as well as a comparison with similar homes in the area
Home Values in the Area
Average Home Value in this Area
Purchase History
| Date | Buyer | Sale Price | Title Company |
|---|---|---|---|
| Lugo Adam | $74,300 | -- | |
| Lugo Adam | $24,700 | -- | |
| Moore Paul F | -- | -- | |
| Moore Paul J | -- | -- | |
| Roberts Virginia G | -- | -- |
Source: Public Records
Mortgage History
| Date | Status | Borrower | Loan Amount |
|---|---|---|---|
| Open | Lugo Adam | $99,000 |
Source: Public Records
Tax History Compared to Growth
Tax History
| Year | Tax Paid | Tax Assessment Tax Assessment Total Assessment is a certain percentage of the fair market value that is determined by local assessors to be the total taxable value of land and additions on the property. | Land | Improvement |
|---|---|---|---|---|
| 2024 | $3,526 | $61,050 | $11,730 | $49,320 |
| 2023 | $3,488 | $61,040 | $11,725 | $49,315 |
| 2022 | $2,443 | $33,540 | $7,950 | $25,590 |
| 2021 | $2,446 | $33,540 | $7,950 | $25,590 |
| 2020 | $2,449 | $33,540 | $7,950 | $25,590 |
| 2019 | $2,085 | $26,430 | $6,370 | $20,060 |
| 2018 | $2,075 | $26,430 | $6,370 | $20,060 |
| 2017 | $2,226 | $26,430 | $6,370 | $20,060 |
| 2016 | $2,369 | $27,160 | $4,480 | $22,680 |
| 2015 | $2,067 | $27,160 | $4,480 | $22,680 |
| 2014 | $2,070 | $27,160 | $4,480 | $22,680 |
| 2013 | $2,257 | $30,170 | $4,970 | $25,200 |
Source: Public Records
Map
Nearby Homes
- 2015 Melrose Ave
- 3685 Cleveland Ave
- 1936 Case Rd
- 1896 Ormond Ave
- 2023 Ferris Rd
- 1997 Ferris Rd
- 2219 Sale Rd
- 2220 Sale Rd
- 1905 Elmore Ave
- 2283 Ward Rd
- 4111 Walford St
- 3750 Dresden St
- 1863 Ward Rd
- 2194 Ashley Dr
- 3609 Westerville Rd Unit P-49
- 4217 Hickman Rd
- 1734 Ferris Rd
- 2144 Colfax Ave
- 3591 Bremen St
- 4090 Cleveland Ave
- 2028 Radnor Ave
- 2048 Radnor Ave
- 2020 Radnor Ave
- 2056 Radnor Ave
- 2045 Ormond Ave
- 2035 Ormond Ave
- 2055 Ormond Ave
- 2035 Radnor Ave
- 2010 Radnor Ave
- 2066 Radnor Ave
- 2045 Radnor Ave
- 2025 Radnor Ave
- 2031 Ormond Ave
- 2063 Ormond Ave
- 2017 Radnor Ave
- 2053 Radnor Ave
- 2017 Ormond Ave
- 2073 Ormond Ave
- 2002 Radnor Ave
- 2074 Radnor Ave