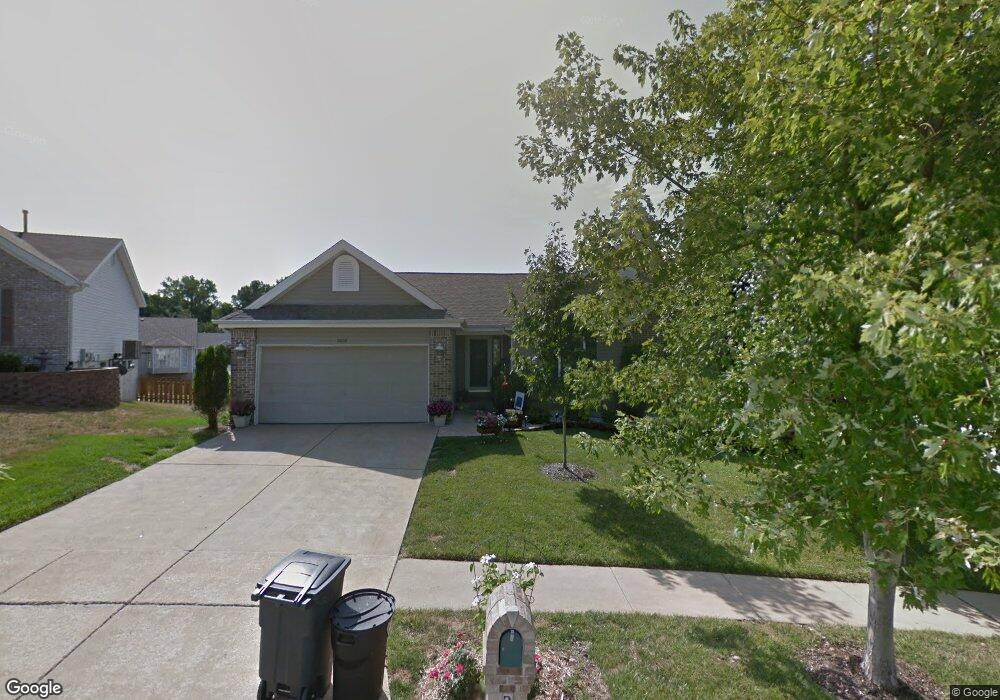
2038 Treybrook Ct Imperial, MO 63052
Estimated Value: $326,362 - $361,000
Studio
--
Bath
1,414
Sq Ft
$247/Sq Ft
Est. Value
About This Home
This home is located at 2038 Treybrook Ct, Imperial, MO 63052 and is currently estimated at $349,591, approximately $247 per square foot. 2038 Treybrook Ct is a home located in Jefferson County with nearby schools including Windsor High School and St. Joseph Catholic School.
Ownership History
Date
Name
Owned For
Owner Type
Purchase Details
Closed on
Jan 23, 2012
Sold by
Horner Kevin B and Horner Nicole B
Bought by
Horner Kevin B and Horner Nicole P
Current Estimated Value
Home Financials for this Owner
Home Financials are based on the most recent Mortgage that was taken out on this home.
Original Mortgage
$144,597
Outstanding Balance
$15,987
Interest Rate
3.35%
Mortgage Type
FHA
Estimated Equity
$333,604
Purchase Details
Closed on
Jul 31, 2000
Sold by
Hart Derron J and Hart Debra A
Bought by
Horner Kevin B and Horner Nicole B
Home Financials for this Owner
Home Financials are based on the most recent Mortgage that was taken out on this home.
Original Mortgage
$126,400
Interest Rate
8.15%
Purchase Details
Closed on
Jul 31, 1998
Sold by
Mcateer John Alex and Mcateer Angela J
Bought by
Hart Derron J and Hart Debra A
Home Financials for this Owner
Home Financials are based on the most recent Mortgage that was taken out on this home.
Original Mortgage
$109,200
Interest Rate
6.94%
Create a Home Valuation Report for This Property
The Home Valuation Report is an in-depth analysis detailing your home's value as well as a comparison with similar homes in the area
Home Values in the Area
Average Home Value in this Area
Purchase History
| Date | Buyer | Sale Price | Title Company |
|---|---|---|---|
| Horner Kevin B | -- | Nations Title Agency Mo Inc | |
| Horner Kevin B | -- | -- | |
| Hart Derron J | -- | Commonwealth Title |
Source: Public Records
Mortgage History
| Date | Status | Borrower | Loan Amount |
|---|---|---|---|
| Open | Horner Kevin B | $144,597 | |
| Closed | Horner Kevin B | $126,400 | |
| Previous Owner | Hart Derron J | $109,200 |
Source: Public Records
Tax History
| Year | Tax Paid | Tax Assessment Tax Assessment Total Assessment is a certain percentage of the fair market value that is determined by local assessors to be the total taxable value of land and additions on the property. | Land | Improvement |
|---|---|---|---|---|
| 2025 | $2,518 | $37,200 | $5,900 | $31,300 |
| 2024 | $2,518 | $32,900 | $4,800 | $28,100 |
| 2023 | $2,518 | $32,900 | $4,800 | $28,100 |
| 2022 | $2,499 | $32,900 | $4,800 | $28,100 |
| 2021 | $2,502 | $32,900 | $4,800 | $28,100 |
| 2020 | $2,260 | $29,200 | $4,200 | $25,000 |
| 2019 | $2,266 | $29,200 | $4,200 | $25,000 |
| 2018 | $2,239 | $29,200 | $4,200 | $25,000 |
| 2017 | $2,158 | $29,200 | $4,200 | $25,000 |
| 2016 | $1,880 | $27,300 | $4,000 | $23,300 |
| 2015 | $1,914 | $27,300 | $4,000 | $23,300 |
| 2013 | $1,914 | $27,300 | $4,000 | $23,300 |
Source: Public Records
Map
Nearby Homes
- 2043 Grants Valley Ln
- 5123 Saddlebrook Pkwy
- 2 Berwick at the Timbers
- 2 Maple at the Timbers
- 3209 White Pine Dr
- 5036 Knotty Alder Dr
- 3247 White Pine Dr
- 2 Aspen II at the Timbers
- 2 Sterling at the Timbers
- 2 Aspen at the Timbers
- 3300 White Pine Dr
- 2 Ashford at the Timbers
- 3030 Yellow Birch Ct
- 3045 Yellow Birch Ct
- 3041 Yellow Birch Ct
- 3013 Yellow Birch Ct
- 3005 Yellow Birch Ct
- 4940 Knotty Alder Dr
- 1900 Chippendale Ln
- 2467 Waterfront Dr
- 2042 Treybrook Ct
- 2034 Treybrook Ct
- 0 Windmill Rd Unit 80019174
- 0 Windmill Rd Unit 13015796
- 0 Windmill Rd Unit 14041818
- 0 Windmill Rd Unit 15008551
- 2047 Grants Valley Ln
- 5182 Saddlebrook Pkwy
- 2051 Grants Valley Ln
- 2030 Treybrook Ct
- 2033 Treybrook Ct
- 5170 Saddlebrook Pkwy
- 2059 Grants Valley Ln
- 2039 Grants Valley Ln
- 2026 Treybrook Ct
- 2067 Grants Valley Ln
- 2025 Treybrook Ct
- 5179 Saddlebrook Pkwy
- 2073 Grants Valley Ln
- 2035 Grants Valley Ln
Your Personal Tour Guide
Ask me questions while you tour the home.