NOT LISTED FOR SALE

2038 van Buskirk Rd Anderson, IN 46011

Estimated Value: $193,000 - $272,000

3 Beds
2 Baths
1,967 Sq Ft
$111/Sq Ft Est. Value

Last Sold February 15, 2013

Last sale price $37,500 $19 Per Sq Ft

Est. 481% increase in value since last sale

Current estimated payment $1,236/month

1 Day on Market

About This Home

As of February 2013

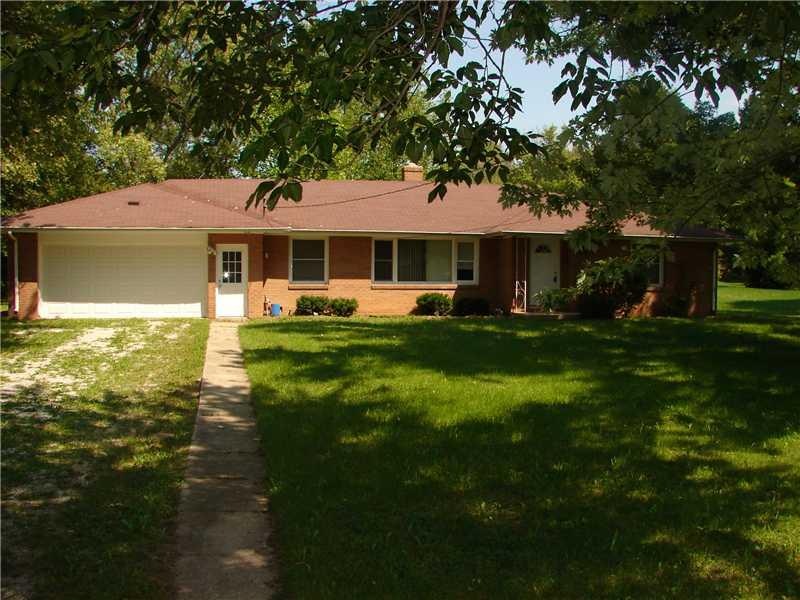
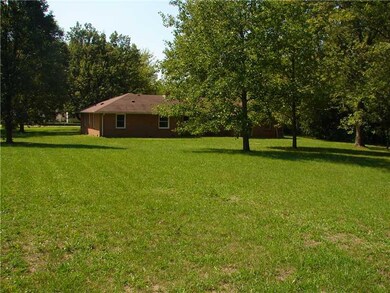
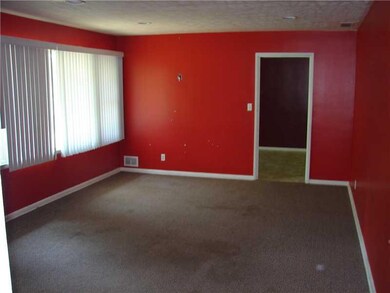
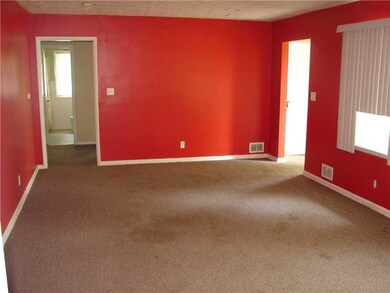
Almost 1 acre!! This is a great investment opportunity for buyer looking for some land with their home. 3 bedroom w/2 full baths. Huge eat-in Kitchen. Garage is great to put workshop in or just park your cars.

Last Agent to Sell the Property

Gene Ott

F.C. Tucker Company License #RB14036991 Listed on: 08/29/2012

F.C. Tucker Company

Last Buyer's Agent

Gary Ruble

Keller Williams Indy Metro NE License #RB14047774

Keller Williams Indy Metro NE

Home Details

Home Type

  • Single Family

Est. Annual Taxes

  • $636

Year Built

  • 1956

Lot Details

  • 0.9

Outdoor Features

  • Covered Patio or Porch

Utilities

  • Heating System Uses Gas
  • Gas Water Heater

Home Details

Home Type

Single Family

Est. Annual Taxes

$636

Year Built

1956

Lot Details

0

Listing Details

  • Property Type: Residential
  • Property Sub Type: Single Family Residence
  • Inspection Warranties: General
  • Transaction Type: Sale
  • Architectural Style: Ranch
  • Directions: Raible Ave. North to Van Buskirk Rd. Turn right on Van Buskirk to home on the left.
  • Garage Yn: Yes
  • New Construction: No
  • Property Attached Yn: No
  • Subdivision Name: VAN BUSKIRK PLACE
  • Special Features: None
  • Year Built: 1956

Interior Features

  • Appliances: None
  • Fireplace Features: None
  • Areas Interior: Bath Sinks Dbl Main
  • Eating Area: Dining Combo/Kitchen,Eat In Kitchen
  • Basement Full Bathrooms: 0
  • Main Level Full Bathrooms: 2
  • Sq Ft Main Upper: 1967
  • Main Level Sq Ft: 1967
  • Basement Half Bathrooms: 0
  • Main Half Bathrooms: 0
  • Master Bedroom Description: Shower Stall Full,Main Level
  • Below Grade Sq Ft: 0
  • Upper Level Sq Ft: 0
  • Bathroom Areas: 2.0000
  • Optional Level Below Grade: No Basement
  • Basement YN: No
  • Full Bathrooms: 2
  • Total Bedrooms: 3
  • Interior Amenities: Wood Work Painted
  • Other Equipment: Smoke Detector

Exterior Features

  • Exterior Features: Driveway Gravel
  • Foundation Details: Crawl Space
  • Association Maintained Building Exterior: 0
  • Porch: Covered Porch
  • Construction Type: Brick
  • Disclosures: Not Applicable

Garage/Parking

  • Fuel: Gas
  • Garage Parking Description: 2 Car Attached

Utilities

  • Cooling: None
  • Heating: Forced Air
  • Solid Waste: 1
  • Water Heater: Gas
  • Sewer: Sewer Connected
  • Water Source: Public

Lot Info

  • Acres: 1/2-1 Acre
  • Lot Information: Not In Subdivision,Tree Mature
  • Lot Number: 29&30
  • Lot Size: .90

Tax Info

  • Semi Annual Property Tax Amt: 318
  • Tax Exemption: None
  • Tax Annual Amount: 636
  • Tax Year: 2011

MLS Schools

  • School District: Anderson Community

Ownership History

Date Name Owned For Owner Type

Purchase Details

Listed on
Aug 29, 2012
Closed on
Feb 15, 2013
Sold by
Cavanaugh Julie D and Baber Jullie D
Bought by
Stephenson Martin and Stephenson Christy
Seller's Agent
Gene Ott
F.C. Tucker Company
Buyer's Agent
Gary Ruble
Keller Williams Indy Metro NE
List Price
$37,500
Sold Price
$37,500
Current Estimated Value
$217,886

Home Financials for this Owner

Home Financials are based on the most recent Mortgage that was taken out on this home.
Estimated Appreciation
$180,386
Avg. Annual Appreciation
14.26%
Source: Public Records

Range of Values:

Collateral Analytics

Collateral Analytics Collateral Analytics AVMs (Automated Valuation Model) employ a number of statistical approaches combined with neighborhood-specific comparable selection guarantees the most up-to-date and precise valuations.

Not Available

Collateral Analytics does not have data for the current month. Please view the chart for historical values.

ICE

ICE Mortgage Technology ICE Mortgage Technology’s AVM (Automated Valuation Model) is a state-of-the-art online residential property valuation tool that provides a quick and accurate estimate of the value of almost any home in the U.S.

Not Available

ICE Mortgage Technology does not have data for the current month. Please view the chart for historical values.

First American

First American First American Data & Analytics’ next-generation AVM combines unrivaled data assets with a blended ensemble of valuation models to produce highly accurate, reliable valuations you can trust.

Not Available

First American does not have data for the current month. Please view the chart for historical values.

Quantarium

Quantarium Quantarium’s valuation service, repeatedly proven the industry’s most accurate and comprehensive, is supercharged with a self-learning and auto-tuning AI engine that continually becomes smarter and more accurate as it processes daily inputs from the industry’s leading RE data lake.

Not Available

Quantarium does not have data for the current month. Please view the chart for historical values.

Average Value
Not Available
List Price
Sold Price
Create a Home Valuation Report for This Property
The Home Valuation Report is an in-depth analysis detailing your home's value as well as a comparison with similar homes in the area

Home Values in the Area

Source: Public Records

Average Home Value in this Area


Source: Public Records

Purchase History

Date Buyer Sale Price Title Company
Stephenson Martin -- None Available
Source: Public Records

Property History

Date Event Price Change Sq Ft Price
02/15/2013 02/15/13 Sold $37,500 0.0% $19 / Sq Ft
08/31/2012 08/31/12 Pending -- -- --
08/29/2012 08/29/12 For Sale $37,500 -- $19 / Sq Ft
Source: MIBOR Broker Listing Cooperative®

Tax History Compared to Growth

Source: Public Records

Tax History

Year Tax Paid Tax Assessment Tax Assessment Total Assessment is a certain percentage of the fair market value that is determined by local assessors to be the total taxable value of land and additions on the property. Land Improvement
2024 $967 $90,800 $12,300 $78,500
2023 $717 $66,000 $11,700 $54,300
2022 $721 $66,100 $11,300 $54,800
2021 $670 $61,100 $11,200 $49,900
2020 $641 $58,200 $10,600 $47,600
2019 $1,521 $56,800 $10,600 $46,200
2018 $793 $47,000 $4,800 $42,200
2017 $483 $46,500 $4,800 $41,700
2016 $773 $48,100 $4,800 $43,300
2014 $1,063 $106,300 $7,400 $98,900
2013 $1,063 $106,300 $7,400 $98,900
Source: Public Records

Agents Affiliated with this Home

  • Section Image
  • Section Image
See All Agents

Map

Source: MIBOR Broker Listing Cooperative®

MLS Number: 21194208

MIBOR Broker Listing Cooperative®

APN: 48-11-02-304-003.000-003