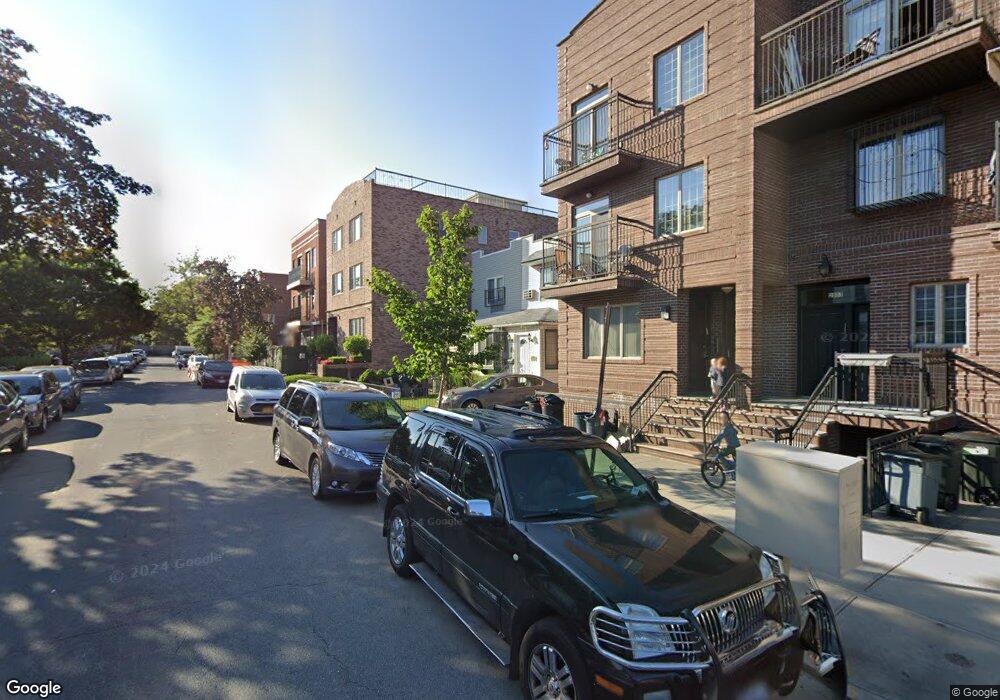
2039 58th St Brooklyn, NY 11204
Borough Park NeighborhoodEstimated Value: $2,139,000
--
Bed
--
Bath
5,940
Sq Ft
$360/Sq Ft
Est. Value
About This Home
This home is located at 2039 58th St, Brooklyn, NY 11204 and is currently estimated at $2,139,000, approximately $360 per square foot. 2039 58th St is a home located in Kings County with nearby schools including P.S. 121 Nelson A Rockefeller, Franklin Delano Roosevelt High School, and Barkai Yeshivah.
Ownership History
Date
Name
Owned For
Owner Type
Purchase Details
Closed on
Nov 14, 2016
Sold by
Jb Real Estate Holdings Llc
Bought by
Brach Joel
Current Estimated Value
Purchase Details
Closed on
Mar 7, 2005
Sold by
Rokach Daniel
Bought by
Jb Real Estate Holdings Llc
Purchase Details
Closed on
Jul 14, 2004
Sold by
Aragon Russell and Deluca Geraldine
Bought by
Rokach Daniel
Home Financials for this Owner
Home Financials are based on the most recent Mortgage that was taken out on this home.
Original Mortgage
$680,000
Interest Rate
6.33%
Mortgage Type
Purchase Money Mortgage
Purchase Details
Closed on
Jan 25, 2002
Sold by
Deluca Rose
Bought by
Deluca Geraldine and Papa Linda Aragon
Create a Home Valuation Report for This Property
The Home Valuation Report is an in-depth analysis detailing your home's value as well as a comparison with similar homes in the area
Home Values in the Area
Average Home Value in this Area
Purchase History
| Date | Buyer | Sale Price | Title Company |
|---|---|---|---|
| Brach Joel | -- | -- | |
| Jb Real Estate Holdings Llc | $900,000 | -- | |
| Jb Real Estate Holdings Llc | $900,000 | -- | |
| Rokach Daniel | $850,000 | -- | |
| Rokach Daniel | $850,000 | -- | |
| Deluca Geraldine | -- | -- | |
| Deluca Geraldine | -- | -- |
Source: Public Records
Mortgage History
| Date | Status | Borrower | Loan Amount |
|---|---|---|---|
| Previous Owner | Rokach Daniel | $85,000 | |
| Previous Owner | Rokach Daniel | $680,000 |
Source: Public Records
Tax History Compared to Growth
Tax History
| Year | Tax Paid | Tax Assessment Tax Assessment Total Assessment is a certain percentage of the fair market value that is determined by local assessors to be the total taxable value of land and additions on the property. | Land | Improvement |
|---|---|---|---|---|
| 2025 | $17,939 | $292,500 | $35,100 | $257,400 |
| 2024 | $17,939 | $277,440 | $35,100 | $242,340 |
| 2023 | $13,087 | $270,000 | $35,100 | $234,900 |
| 2022 | $8,123 | $288,780 | $35,100 | $253,680 |
| 2021 | $3,788 | $222,960 | $35,100 | $187,860 |
| 2020 | $1,883 | $223,560 | $35,100 | $188,460 |
| 2019 | $3,765 | $204,660 | $35,100 | $169,560 |
| 2018 | $3,669 | $111,744 | $24,743 | $87,001 |
| 2017 | $3,669 | $109,532 | $27,174 | $82,358 |
| 2016 | $3,598 | $103,333 | $23,558 | $79,775 |
| 2015 | $1,131 | $97,484 | $33,332 | $64,152 |
| 2014 | $1,131 | $95,040 | $39,000 | $56,040 |
Source: Public Records
Map
Nearby Homes
- 2045 58th St
- 2035 58th St
- 2047 58th St
- 2033 58th St
- 2051 58th St
- 2051 58th St Unit 3
- 2051 58th St Unit 2
- 2051 58th St Unit 1
- 2029 58th St
- 2040 57th St
- 2053 58th St
- 2053 58th St Unit 2
- 2053 58th St Unit 1
- 2053 58th St Unit 3
- 2036 57th St
- 2048 57th St
- 2027 58th St
- 2034 57th St
- 2050 57th St
- 2057 58th St