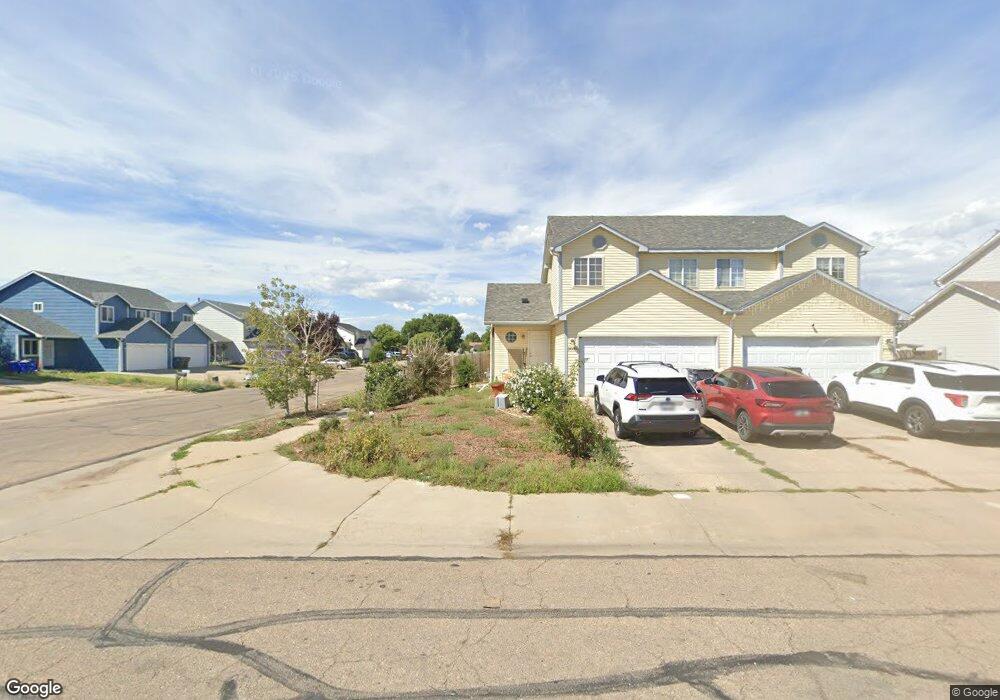
2039 Birch Ave Greeley, CO 80631
Estimated Value: $341,000 - $347,120
3
Beds
2
Baths
1,178
Sq Ft
$292/Sq Ft
Est. Value
About This Home
This home is located at 2039 Birch Ave, Greeley, CO 80631 and is currently estimated at $344,373, approximately $292 per square foot. 2039 Birch Ave is a home located in Weld County with nearby schools including Bella Romero Academy, Greeley Central High School, and Salida Del Sol Academy.
Ownership History
Date
Name
Owned For
Owner Type
Purchase Details
Closed on
Apr 22, 2013
Sold by
Harrison Amanda and Clark Amanda Sue
Bought by
Clark Amanda Sue
Current Estimated Value
Home Financials for this Owner
Home Financials are based on the most recent Mortgage that was taken out on this home.
Original Mortgage
$76,382
Outstanding Balance
$52,914
Interest Rate
3.67%
Mortgage Type
FHA
Estimated Equity
$291,459
Purchase Details
Closed on
Jun 19, 2008
Sold by
Hud
Bought by
Harrison Amanda
Purchase Details
Closed on
Feb 4, 2008
Sold by
Mariani Nancy Jo
Bought by
Secretary Of Hud
Purchase Details
Closed on
May 31, 2002
Sold by
Journey Homes Llc
Bought by
Mariani Nancy Jo
Home Financials for this Owner
Home Financials are based on the most recent Mortgage that was taken out on this home.
Original Mortgage
$120,843
Interest Rate
6.92%
Mortgage Type
FHA
Create a Home Valuation Report for This Property
The Home Valuation Report is an in-depth analysis detailing your home's value as well as a comparison with similar homes in the area
Purchase History
We collect this data history from publicly available records. To have your information removed, we recommend requesting removal directly through your county’s website.
| Date | Buyer | Sale Price | Title Company |
|---|---|---|---|
| Clark Amanda Sue | -- | Land Title Guarantee Company | |
| Harrison Amanda | -- | None Available | |
| Secretary Of Hud | -- | None Available | |
| Mariani Nancy Jo | $121,924 | -- |
Source: Public Records
Mortgage History
We collect this data history from publicly available records. To have your information removed, we recommend requesting removal directly through your county’s website.
| Date | Status | Borrower | Loan Amount |
|---|---|---|---|
| Open | Clark Amanda Sue | $76,382 | |
| Previous Owner | Mariani Nancy Jo | $120,843 |
Source: Public Records
Tax History
| Year | Tax Paid | Tax Assessment Tax Assessment Total Assessment is a certain percentage of the fair market value that is determined by local assessors to be the total taxable value of land and additions on the property. | Land | Improvement |
|---|---|---|---|---|
| 2026 | $1,847 | $19,810 | $3,490 | $16,320 |
| 2025 | $1,310 | $20,230 | $3,560 | $16,670 |
| 2024 | $1,249 | $19,140 | $3,820 | $15,320 |
| 2023 | $1,249 | $19,330 | $3,860 | $15,470 |
| 2022 | $1,404 | $16,100 | $2,610 | $13,490 |
| 2021 | $1,447 | $16,550 | $2,680 | $13,870 |
| 2020 | $1,196 | $13,720 | $2,360 | $11,360 |
| 2019 | $1,199 | $13,720 | $2,360 | $11,360 |
| 2018 | $812 | $9,800 | $2,160 | $7,640 |
| 2017 | $816 | $9,800 | $2,160 | $7,640 |
| 2016 | $660 | $8,920 | $1,590 | $7,330 |
| 2015 | $658 | $8,920 | $1,590 | $7,330 |
| 2014 | $398 | $5,270 | $1,510 | $3,760 |
Source: Public Records
Map
Nearby Homes
- 861 E 20th Street Ln
- 850 E 21st St
- 2211 Aspen Ave
- 2301 Alpine Ave
- 1401 E Highway 34
- 233 E 19th Street Rd
- 1550 E 18th St Unit 3
- 1916 Delwood Ave
- 2510 Cedar Ave
- 1833 Dilmont Ave
- 727 E 27th St
- 2601 Alpine Ave
- 406 E 28th Street Dr
- 2015 5th Ave Unit A and B
- 229 15th St
- 507 22nd St
- 1317 2nd Ave
- 316 E 28th Street Ln
- 2038 6th Ave
- 2333 5th Ave
- 2035 Birch Ave
- 886 E 20 Street Rd
- 881 E 20th Street Rd
- 2031 Birch Ave
- 881 20th Ave
- 880 E 20 Street Rd
- 875 E 20th Street Rd
- 2027 Birch Ave
- 898 E 20th Street Rd
- 892 20th St
- 892 E 20th Street Rd
- 898 E 20th Street Rd
- 886 E 20th Street Rd
- 869 E 20th Street Rd
- 869 E 20th Street Rd
- 880 E 20th Street Rd
- 2023 Birch Ave
- 2030 Birch Ave
- 2038 Birch Ave
- 874 E 20th Street Rd
Your Personal Tour Guide
Ask me questions while you tour the home.