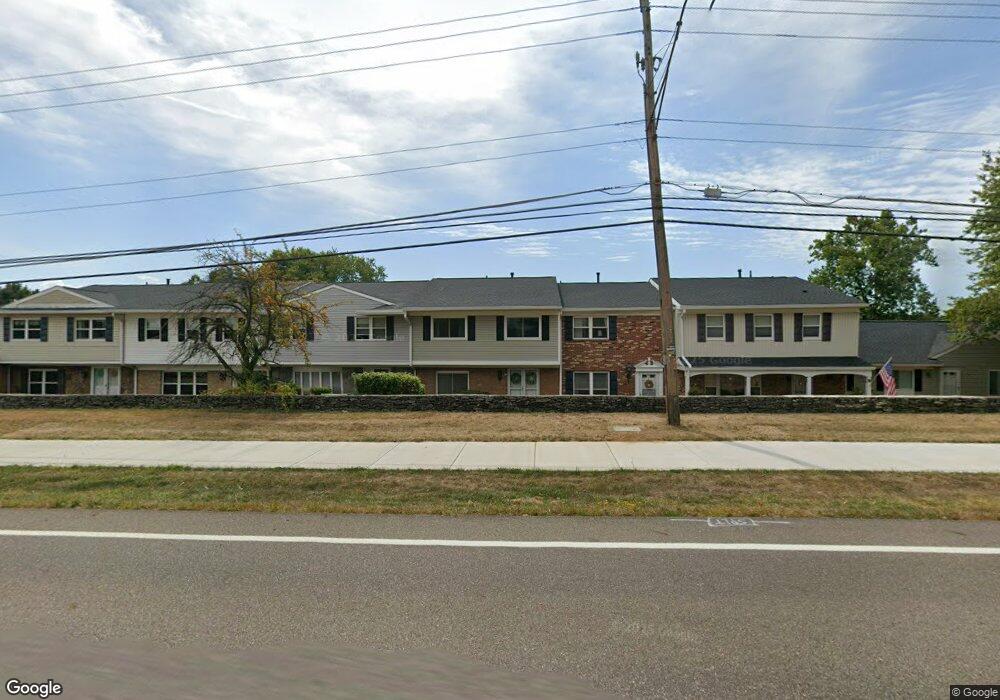
2039 Carlile Dr Uniontown, OH 44685
Estimated Value: $205,038 - $232,000
3
Beds
3
Baths
1,680
Sq Ft
$128/Sq Ft
Est. Value
About This Home
This home is located at 2039 Carlile Dr, Uniontown, OH 44685 and is currently estimated at $214,760, approximately $127 per square foot. 2039 Carlile Dr is a home located in Summit County with nearby schools including Greenwood Elementary School, Green Primary School, and Green Intermediate Elementary School.
Ownership History
Date
Name
Owned For
Owner Type
Purchase Details
Closed on
Apr 30, 2003
Sold by
Glover James A and Glover Dawn M
Bought by
Smith T Scott
Current Estimated Value
Home Financials for this Owner
Home Financials are based on the most recent Mortgage that was taken out on this home.
Original Mortgage
$93,000
Outstanding Balance
$40,626
Interest Rate
5.86%
Estimated Equity
$174,134
Purchase Details
Closed on
Oct 12, 2000
Sold by
Caetta Rita M
Bought by
Glover James A and Glover Dawn M
Home Financials for this Owner
Home Financials are based on the most recent Mortgage that was taken out on this home.
Original Mortgage
$72,500
Interest Rate
8.03%
Create a Home Valuation Report for This Property
The Home Valuation Report is an in-depth analysis detailing your home's value as well as a comparison with similar homes in the area
Home Values in the Area
Average Home Value in this Area
Purchase History
| Date | Buyer | Sale Price | Title Company |
|---|---|---|---|
| Smith T Scott | $110,500 | Midland Commerce Group Fairl | |
| Glover James A | $99,500 | Midland Commerce Group |
Source: Public Records
Mortgage History
| Date | Status | Borrower | Loan Amount |
|---|---|---|---|
| Open | Smith T Scott | $93,000 | |
| Previous Owner | Glover James A | $72,500 |
Source: Public Records
Tax History Compared to Growth
Tax History
| Year | Tax Paid | Tax Assessment Tax Assessment Total Assessment is a certain percentage of the fair market value that is determined by local assessors to be the total taxable value of land and additions on the property. | Land | Improvement |
|---|---|---|---|---|
| 2025 | $2,977 | $60,991 | $6,699 | $54,292 |
| 2024 | $2,977 | $60,991 | $6,699 | $54,292 |
| 2023 | $2,977 | $60,991 | $6,699 | $54,292 |
| 2022 | $2,314 | $42,049 | $4,557 | $37,492 |
| 2021 | $2,177 | $42,049 | $4,557 | $37,492 |
| 2020 | $2,137 | $42,050 | $4,560 | $37,490 |
| 2019 | $2,045 | $37,620 | $4,510 | $33,110 |
| 2018 | $2,088 | $37,620 | $4,120 | $33,500 |
| 2017 | $1,951 | $37,620 | $4,120 | $33,500 |
| 2016 | $1,882 | $32,860 | $4,120 | $28,740 |
| 2015 | $1,951 | $32,860 | $4,120 | $28,740 |
| 2014 | $1,939 | $32,860 | $4,120 | $28,740 |
| 2013 | $2,029 | $34,230 | $4,120 | $30,110 |
Source: Public Records
Map
Nearby Homes
- 2043 Carlile Dr Unit 109
- 2694 Cardington Green Unit 23A
- 3495 Chadwick Dr
- 3605 Elmhurst Cir
- 2111 Prestwick Dr Unit 3A
- 3609 Glenshire Cir Unit 55B
- 2186 Prestwick Dr
- 2189 E Park Dr
- 2185 Prestwick Dr
- 3314 Millwood Ln NW
- 1763 Fairway Dr
- 2511 Royal County Down
- 0 Raber Terrace
- 2535 Royal County Down Unit B
- 3544 Raber Terrace
- 2500 Marlborough Dr
- Sarasota Plan at Spring Hill - Spring Hill Villas
- Chester Plan at Spring Hill - Spring Hill Villas
- Kenai Plan at Spring Hill - Spring Hill Villas
- Holston Plan at Spring Hill - Spring Hill Villas
- 2041 Carlile Dr
- 2041 Carlile Dr Unit 108
- 2037 Carlile Dr Unit 106
- 2043 Carlile Dr
- 2035 Carlile Dr
- 2045 Carlile Dr
- 2038 Carlile Dr Unit 96
- 2040 Carlile Dr Unit 95
- 2036 Carlile Dr Unit 97
- 2042 Carlile Dr
- 2042 Carlile Dr Unit 94
- 2047 Carlile Dr Unit 111
- 2034 Carlile Dr
- 2044 Carlile Dr
- 2032 Carlile Dr Unit 99
- 2048 Carlile Dr
- 2051 Carlile Dr
- 2053 Carlile Dr
- 2052 Carlile Dr
- 2052 Carlile Dr Unit 91