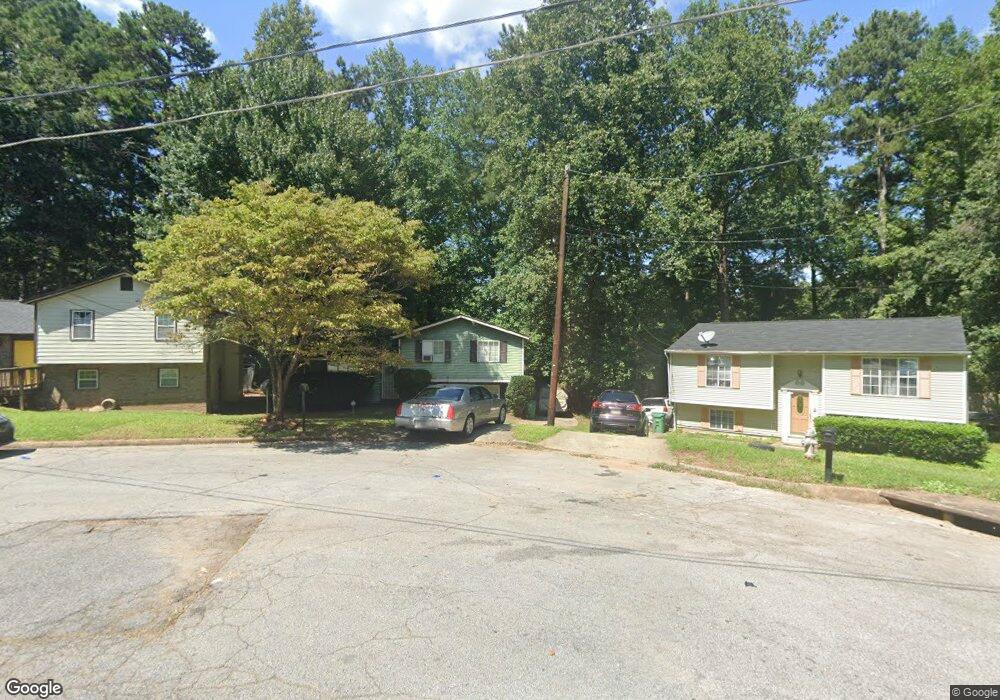
2039 Countydown Ln Stone Mountain, GA 30088
Estimated Value: $154,000 - $217,000
3
Beds
1
Bath
1,040
Sq Ft
$172/Sq Ft
Est. Value
About This Home
This home is located at 2039 Countydown Ln, Stone Mountain, GA 30088 and is currently estimated at $178,912, approximately $172 per square foot. 2039 Countydown Ln is a home located in DeKalb County with nearby schools including Panola Way Elementary School, Miller Grove Middle School, and Miller Grove High School.
Ownership History
Date
Name
Owned For
Owner Type
Purchase Details
Closed on
Jun 23, 2009
Sold by
Federal National Mortgage Association
Bought by
Polite Kenneth M and Simmons-Polite Renee
Current Estimated Value
Purchase Details
Closed on
Feb 3, 2009
Sold by
Aurora Ln Svcs Llc
Bought by
Federal Natl Mtg Assn Fnma
Purchase Details
Closed on
May 26, 2006
Sold by
Bank Of New York 2001-2
Bought by
Solomon Christopher
Purchase Details
Closed on
Oct 4, 2005
Sold by
Culpepper Troy L and Culpepper Elaine K
Bought by
Bank Of Ny
Purchase Details
Closed on
Mar 20, 2000
Sold by
Hud
Bought by
Culpepper Troy L and Culpepper Elaine K
Home Financials for this Owner
Home Financials are based on the most recent Mortgage that was taken out on this home.
Original Mortgage
$68,850
Interest Rate
10.63%
Mortgage Type
New Conventional
Purchase Details
Closed on
Mar 2, 1999
Sold by
Chase Mtg Svcs Inc
Bought by
Secretary and Hud
Create a Home Valuation Report for This Property
The Home Valuation Report is an in-depth analysis detailing your home's value as well as a comparison with similar homes in the area
Home Values in the Area
Average Home Value in this Area
Purchase History
| Date | Buyer | Sale Price | Title Company |
|---|---|---|---|
| Polite Kenneth M | -- | -- | |
| Federal Natl Mtg Assn Fnma | -- | -- | |
| Aurora Ln Svcs Llc | -- | -- | |
| Solomon Christopher | $68,000 | -- | |
| Bank Of Ny | $76,293 | -- | |
| Culpepper Troy L | -- | -- | |
| Secretary | -- | -- | |
| Chase Mtg Svc Inc | $77,371 | -- |
Source: Public Records
Mortgage History
| Date | Status | Borrower | Loan Amount |
|---|---|---|---|
| Previous Owner | Culpepper Troy L | $68,850 |
Source: Public Records
Tax History
| Year | Tax Paid | Tax Assessment Tax Assessment Total Assessment is a certain percentage of the fair market value that is determined by local assessors to be the total taxable value of land and additions on the property. | Land | Improvement |
|---|---|---|---|---|
| 2025 | $1,915 | $72,280 | $16,000 | $56,280 |
| 2024 | $2,147 | $81,800 | $16,000 | $65,800 |
| 2023 | $2,147 | $66,520 | $8,800 | $57,720 |
Source: Public Records
Map
Nearby Homes
- 2080 Countydown Ln
- 2051 Kimber Trail
- 2083 Tidwell Trail
- 2036 Countydown Ln
- 5268 Kinsdale Ln
- 2058 Scarbrough Dr
- 5350 Olde St
- 2045 Scarbrough Dr
- 5333 Olde St
- 1983 Northerly Way
- 5323 Scarbrough Round
- 5358 Brooklands Dr
- 2230 Mulsanne Dr
- 2174 Scarbrough Rd
- 2116 Scarbrough Rd
- 2123 Panola Rd
- 2169 Panola Rd
- 5427 Forest Pines Dr
- 2327 Young Rd
- 6017 Covington Hwy
- 2033 Countydown Ln
- 2033 Countydown Ln
- 2045 Countydown Ln
- 2070 Scarbrough Dr
- 2030 Countydown Ln
- 2051 Countydown Ln
- 2082 Scarbrough Dr
- 2064 Scarbrough Dr
- 2088 Scarbrough Dr
- 2057 Countydown Ln
- 2054 Countydown Ln
- 2042 Countydown Ln
- 2048 Countydown Ln
- 2052 Scarbrough Dr
- 2062 Countydown Ln
- 2094 Scarbrough Dr
- 5320 Olde St
- 5314 Olde St
- 1999 Overton Trail
- 2063 Countydown Ln
Your Personal Tour Guide
Ask me questions while you tour the home.