
Seller's Agent in 2017
Jenny Wang
JWang Properties Jenny Wang
(281) 451-0185
1 in this area
41 Total Sales

Estimated Value: $265,780 - $278,000
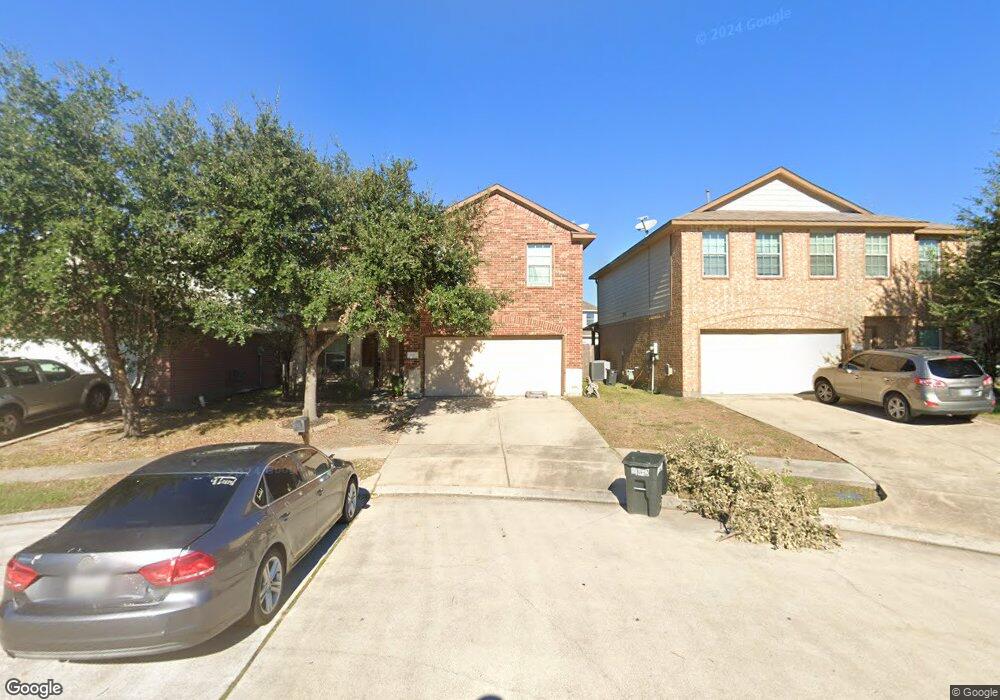
Open Sunday 04/09, 1-3 PM. Gorgeous home on Cul-De-Sac: Open kitchen with granite counter top, ample cabinets, custom lighting & stainless steel appliances, tile flooring in living, dinning & kitchen. Master bathroom with double sinks, garden tub, walk-in closet & separate shower. Spacious game room with extra work room & huge closet. Guest bedrooms with Hollywood bath & double walk-in closets. Lush landscaping & covered patio in the backyard. Community with park, skate & soccer field.
Last Agent to Sell the Property
JWang Properties Jenny Wang License #0499154 Listed on: 03/15/2017
We collect this data history from publicly available records. To have your information removed, we recommend requesting removal directly through your county’s website.
| Date | Buyer | Sale Price | Title Company |
|---|---|---|---|
| Portillo Erica | -- | Chicago Title | |
| Quichocho Rosita Ichihara | -- | None Available | |
| Hacienda Services Inc | -- | None Available | |
| Hacienda Services Inc | -- | None Available |
We collect this data history from publicly available records. To have your information removed, we recommend requesting removal directly through your county’s website.
| Date | Status | Borrower | Loan Amount |
|---|---|---|---|
| Open | Portillo Erica | $173,533 | |
| Previous Owner | Quichocho Rosita Ichihara | $158,780 |
| Date | Event | Price | List to Sale | Price per Sq Ft |
|---|---|---|---|---|
| 05/25/2017 05/25/17 | Sold | -- | -- | -- |
| 04/24/2017 04/24/17 | Pending | -- | -- | -- |
| 03/15/2017 03/15/17 | For Sale | $184,900 | -- | $77 / Sq Ft |
| Year | Tax Paid | Tax Assessment Tax Assessment Total Assessment is a certain percentage of the fair market value that is determined by local assessors to be the total taxable value of land and additions on the property. | Land | Improvement |
|---|---|---|---|---|
| 2025 | $5,044 | $252,248 | $45,508 | $206,740 |
| 2024 | $6,128 | $279,146 | $45,508 | $233,638 |
| 2023 | $6,128 | $299,091 | $45,508 | $253,583 |
| 2022 | $6,746 | $265,492 | $36,406 | $229,086 |
| 2021 | $6,488 | $218,379 | $24,271 | $194,108 |
| 2020 | $6,194 | $194,876 | $24,271 | $170,605 |
| 2019 | $6,292 | $190,675 | $24,271 | $166,404 |
| 2018 | $1,700 | $185,799 | $24,271 | $161,528 |
| 2017 | $6,072 | $185,799 | $24,271 | $161,528 |
| 2016 | $5,844 | $178,831 | $24,271 | $154,560 |
| 2015 | $4,334 | $178,831 | $24,271 | $154,560 |
| 2014 | $4,334 | $128,272 | $24,271 | $104,001 |
Seller's Agent in 2017
Jenny Wang
JWang Properties Jenny Wang
(281) 451-0185
1 in this area
41 Total Sales
Buyer's Agent in 2017
Cyril Okeke
Greer Real Estate Solution, LLC
(832) 692-6348
2 in this area
62 Total Sales
Source: Houston Association of REALTORS®
MLS Number: 71212484
APN: 1277510020014
Disclaimer: Certain information contained herein is derived from information provided by parties other than Homes.com. All information provided is deemed reliable, but is not guaranteed to be accurate and should be independently verified.
![]() Copyright 2026, Houston REALTORS® Information Service, Inc.
Copyright 2026, Houston REALTORS® Information Service, Inc.
The information provided is exclusively for consumers’ personal, non-commercial use, and may not be used for any purpose other than to identify prospective properties consumers may be interested in purchasing.
Information is deemed reliable but not guaranteed.
Ask me questions while you tour the home.