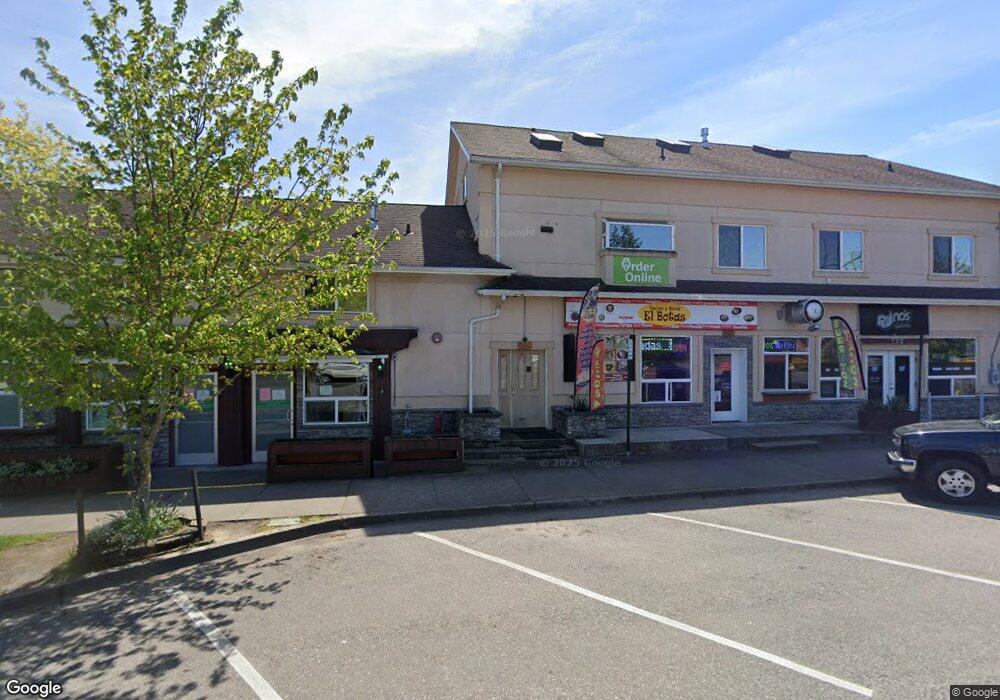
2039 James St Bellingham, WA 98225
Sunnyland Neighborhood
--
Bed
1
Bath
6,368
Sq Ft
4,356
Sq Ft Lot
About This Home
This home is located at 2039 James St, Bellingham, WA 98225. 2039 James St is a home located in Whatcom County with nearby schools including Sunnyland Elementary School, Whatcom Middle School, and Bellingham High School.
Ownership History
Date
Name
Owned For
Owner Type
Purchase Details
Closed on
Mar 1, 2012
Sold by
Farook Mohammed and Farook Anjala
Bought by
Maa Investments Llc
Purchase Details
Closed on
Sep 6, 2001
Sold by
Trustees Of The Assn Of Western Pulp & P
Bought by
Farook Mohammed and Farook Anjala
Home Financials for this Owner
Home Financials are based on the most recent Mortgage that was taken out on this home.
Original Mortgage
$92,566
Interest Rate
7.05%
Create a Home Valuation Report for This Property
The Home Valuation Report is an in-depth analysis detailing your home's value as well as a comparison with similar homes in the area
Home Values in the Area
Average Home Value in this Area
Purchase History
| Date | Buyer | Sale Price | Title Company |
|---|---|---|---|
| Maa Investments Llc | $438,000 | None Available | |
| Farook Mohammed | $118,750 | Charter Title Corporation |
Source: Public Records
Mortgage History
| Date | Status | Borrower | Loan Amount |
|---|---|---|---|
| Previous Owner | Farook Mohammed | $92,566 |
Source: Public Records
Tax History Compared to Growth
Tax History
| Year | Tax Paid | Tax Assessment Tax Assessment Total Assessment is a certain percentage of the fair market value that is determined by local assessors to be the total taxable value of land and additions on the property. | Land | Improvement |
|---|---|---|---|---|
| 2024 | $6,599 | $932,919 | $262,860 | $670,059 |
| 2023 | $6,599 | $848,095 | $238,960 | $609,135 |
| 2022 | $6,593 | $823,394 | $232,000 | $591,394 |
| 2021 | $6,986 | $709,822 | $200,000 | $509,822 |
| 2020 | $6,864 | $709,822 | $200,000 | $509,822 |
| 2019 | $5,847 | $674,148 | $169,388 | $504,760 |
| 2018 | $6,403 | $575,692 | $149,388 | $426,304 |
| 2017 | $4,976 | $539,033 | $139,875 | $399,158 |
| 2016 | $4,780 | $437,840 | $128,625 | $309,215 |
| 2015 | $4,801 | $437,840 | $128,625 | $309,215 |
| 2014 | -- | $425,500 | $125,000 | $300,500 |
| 2013 | -- | $424,545 | $122,500 | $302,045 |
Source: Public Records
Map
Nearby Homes