Estimated Value: $983,959 - $1,427,000
4
Beds
5
Baths
4,145
Sq Ft
$276/Sq Ft
Est. Value
About This Home
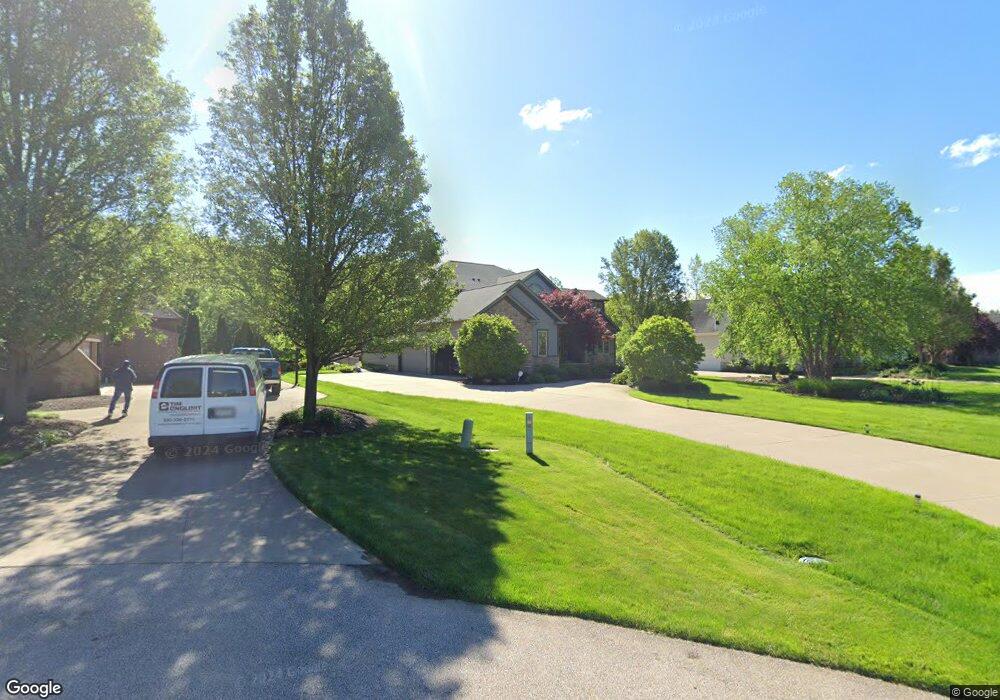
This home is located at 2039 N Meadow Cir, Akron, OH 44333 and is currently estimated at $1,144,740, approximately $276 per square foot. 2039 N Meadow Cir is a home located in Summit County with nearby schools including Richfield Elementary School, Bath Elementary School, and Revere Middle School.
Ownership History
Date
Name
Owned For
Owner Type
Purchase Details
Closed on
Apr 19, 2023
Sold by
Kathryn A Spector Family Trust
Bought by
Michael L Spector Family Trust
Current Estimated Value
Purchase Details
Closed on
Jul 25, 2008
Sold by
Spector Michael L and Spector Kathryn A
Bought by
Spector Kathryn A and Kathryn A Spector Family Trust
Purchase Details
Closed on
Nov 8, 2001
Sold by
North Fork Development Company Ltd
Bought by
Spector Michael L and Spector Kathryn A
Home Financials for this Owner
Home Financials are based on the most recent Mortgage that was taken out on this home.
Original Mortgage
$300,700
Interest Rate
6.24%
Create a Home Valuation Report for This Property
The Home Valuation Report is an in-depth analysis detailing your home's value as well as a comparison with similar homes in the area
Home Values in the Area
Average Home Value in this Area
Purchase History
| Date | Buyer | Sale Price | Title Company |
|---|---|---|---|
| Michael L Spector Family Trust | -- | None Listed On Document | |
| Spector Kathryn A | -- | None Available | |
| Spector Michael L | $102,375 | Multiple |
Source: Public Records
Mortgage History
| Date | Status | Borrower | Loan Amount |
|---|---|---|---|
| Previous Owner | Spector Michael L | $300,700 | |
| Closed | Spector Michael L | $100,000 |
Source: Public Records
Tax History Compared to Growth
Tax History
| Year | Tax Paid | Tax Assessment Tax Assessment Total Assessment is a certain percentage of the fair market value that is determined by local assessors to be the total taxable value of land and additions on the property. | Land | Improvement |
|---|---|---|---|---|
| 2025 | $14,824 | $282,695 | $55,034 | $227,661 |
| 2024 | $14,824 | $282,695 | $55,034 | $227,661 |
| 2023 | $14,824 | $282,695 | $55,034 | $227,661 |
| 2022 | $14,271 | $233,766 | $45,483 | $188,283 |
| 2021 | $14,095 | $233,766 | $45,483 | $188,283 |
| 2020 | $13,819 | $233,760 | $45,480 | $188,280 |
| 2019 | $12,759 | $202,220 | $41,470 | $160,750 |
| 2018 | $12,612 | $202,220 | $41,470 | $160,750 |
| 2017 | $11,170 | $202,220 | $41,470 | $160,750 |
| 2016 | $11,596 | $177,360 | $41,470 | $135,890 |
| 2015 | $11,170 | $177,360 | $41,470 | $135,890 |
| 2014 | $10,869 | $177,360 | $41,470 | $135,890 |
| 2013 | $11,594 | $191,800 | $41,470 | $150,330 |
Source: Public Records
Map
Nearby Homes
- 4025 Meadowvale Ct
- 2201 Charles Ln
- 3381 Barrett Rd
- 3288 Spring Valley Rd
- 1345 Ledgewood Dr
- 4464 W Bath Rd
- 1302 Hillandale Dr
- 967 Robinwood Hills Dr
- 1123 N Hametown Rd
- 3534 Thistle Ct
- 692 Pine Point Dr
- 3546 Robert Burns Dr
- 3454 Skye Ridge Dr
- 3478 Yellow Creek Rd
- 3521 Hamilton Dr
- 2917 W Bath Rd
- 3339 Yellow Creek Rd
- 3721 Sanctuary Dr
- 565 Ghentwood Dr
- 77 Carr Rd
- 2049 N Meadow Cir
- 3903 Meadowvale Dr
- 2059 N Meadow Cir
- 3893 Meadowvale Dr
- 2069 N Meadow Cir
- 4012 Meadowvale Ct
- 3963 Meadowvale Ct
- 3908 Meadowvale Dr
- 2079 N Meadow Cir
- 3940 Meadowvale Dr
- 2232 Charles Ln
- 2017 S Meadow Cir
- 3969 Meadowvale Dr
- 3864 Meadowvale Dr
- 2222 Charles Ln
- 2007 S Meadow Cir
- 2141 Firestone Trace
- 3854 Meadowvale Dr
- 2087 Firestone Trace
- 3841 Meadowvale Dr