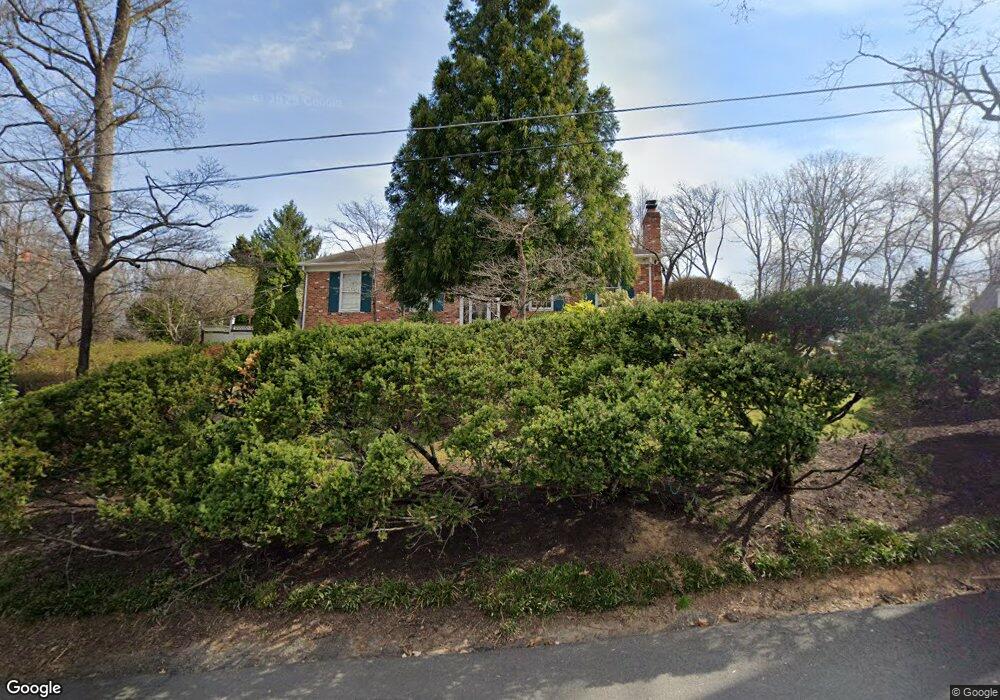
2039 Rhode Island Ave McLean, VA 22101
Estimated Value: $1,704,000 - $2,889,000
Studio
3
Baths
1,458
Sq Ft
$1,399/Sq Ft
Est. Value
About This Home
This home is located at 2039 Rhode Island Ave, McLean, VA 22101 and is currently estimated at $2,039,034, approximately $1,398 per square foot. 2039 Rhode Island Ave is a home located in Fairfax County with nearby schools including Chesterbrook Elementary School, Longfellow Middle School, and McLean High School.
Create a Home Valuation Report for This Property
The Home Valuation Report is an in-depth analysis detailing your home's value as well as a comparison with similar homes in the area
Home Values in the Area
Average Home Value in this Area
Tax History
| Year | Tax Paid | Tax Assessment Tax Assessment Total Assessment is a certain percentage of the fair market value that is determined by local assessors to be the total taxable value of land and additions on the property. | Land | Improvement |
|---|---|---|---|---|
| 2025 | $16,495 | $1,519,550 | $912,000 | $607,550 |
| 2024 | $16,495 | $1,327,740 | $869,000 | $458,740 |
| 2023 | $15,416 | $1,282,830 | $869,000 | $413,830 |
| 2022 | $14,497 | $1,189,830 | $776,000 | $413,830 |
| 2021 | $13,184 | $1,057,830 | $644,000 | $413,830 |
| 2020 | $13,260 | $1,057,830 | $644,000 | $413,830 |
| 2019 | $12,900 | $1,027,120 | $633,000 | $394,120 |
| 2018 | $10,817 | $940,620 | $575,000 | $365,620 |
| 2017 | $11,251 | $911,150 | $575,000 | $336,150 |
| 2016 | $10,686 | $864,230 | $575,000 | $289,230 |
| 2015 | $10,221 | $855,810 | $575,000 | $280,810 |
| 2014 | $10,010 | $839,300 | $564,000 | $275,300 |
Source: Public Records
Map
Nearby Homes
- 5501 36th St N
- 1917 Kenbar Ct
- 5637 34th St N
- 2115 Natahoa Ct
- 1889 Virginia Ave
- 3207 John Marshall Dr
- 6528 36th St N
- 1846 Patton Terrace
- 5148 37th St N
- 1853 Massachusetts Ave
- 2939 N Sycamore St
- 6447 Tucker Ave
- 6512 Williamsburg Blvd
- 1843 Rhode Island Ave
- 6446 Tucker Ave
- 3118 N Harrison St
- 6506 Chesterfield Ave
- 6401 29th St N
- 3013 N Toronto St
- 6407 28th St N
- 2029 Rhode Island Ave
- 2034 Rockingham St
- 2039 Rockingham St
- 2030 Rhode Island Ave
- 2040 Rhode Island Ave
- 2036 Rhode Island Ave
- 2045 Rockingham St
- 2030 Rockingham St
- 2035 Rockingham St
- 2023 Rhode Island Ave
- 2046 Rockingham St
- 2049 Rockingham St
- 2031 Rockingham St
- 2021 Rhode Island Ave
- 2053 Rockingham St
- 2024 Rhode Island Ave
- 2024 Rockingham St
- 2081 Grace Manor Ct
- 2020 Rhode Island Ave
- 2079 Grace Manor Ct
Your Personal Tour Guide
Ask me questions while you tour the home.