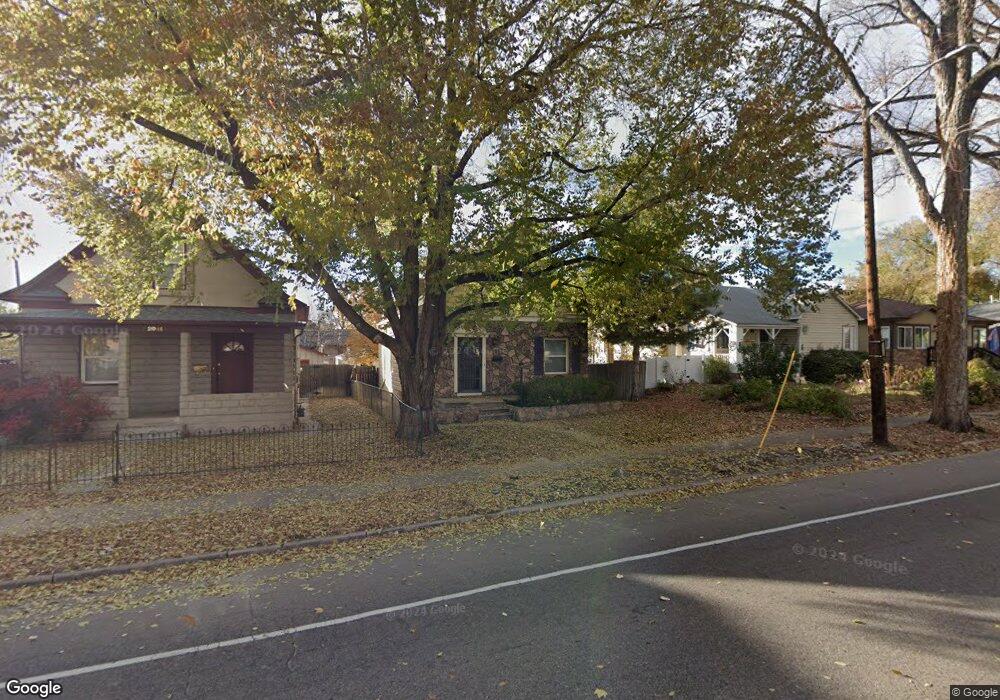
2039 S Downing St Denver, CO 80210
Platt Park NeighborhoodEstimated Value: $614,000 - $758,000
3
Beds
2
Baths
1,224
Sq Ft
$535/Sq Ft
Est. Value
About This Home
This home is located at 2039 S Downing St, Denver, CO 80210 and is currently estimated at $655,366, approximately $535 per square foot. 2039 S Downing St is a home located in Denver County with nearby schools including Asbury Elementary School, Grant Beacon Middle School, and South High School.
Ownership History
Date
Name
Owned For
Owner Type
Purchase Details
Closed on
Aug 23, 2006
Sold by
Basile Mark
Bought by
Pasha Ambereen
Current Estimated Value
Home Financials for this Owner
Home Financials are based on the most recent Mortgage that was taken out on this home.
Original Mortgage
$210,400
Outstanding Balance
$121,026
Interest Rate
6%
Mortgage Type
Unknown
Estimated Equity
$534,340
Purchase Details
Closed on
Aug 1, 2002
Sold by
Bulik Joel N
Bought by
Basile Mark
Home Financials for this Owner
Home Financials are based on the most recent Mortgage that was taken out on this home.
Original Mortgage
$164,720
Interest Rate
6.53%
Purchase Details
Closed on
Jan 25, 2000
Sold by
Frenkel David
Bought by
Bulik Joel N
Home Financials for this Owner
Home Financials are based on the most recent Mortgage that was taken out on this home.
Original Mortgage
$139,650
Interest Rate
7.95%
Create a Home Valuation Report for This Property
The Home Valuation Report is an in-depth analysis detailing your home's value as well as a comparison with similar homes in the area
Home Values in the Area
Average Home Value in this Area
Purchase History
| Date | Buyer | Sale Price | Title Company |
|---|---|---|---|
| Pasha Ambereen | $263,000 | Fahtco | |
| Basile Mark | $205,900 | Stewart Title | |
| Bulik Joel N | $147,000 | -- |
Source: Public Records
Mortgage History
| Date | Status | Borrower | Loan Amount |
|---|---|---|---|
| Open | Pasha Ambereen | $210,400 | |
| Previous Owner | Basile Mark | $164,720 | |
| Previous Owner | Bulik Joel N | $139,650 | |
| Closed | Basile Mark | $30,885 |
Source: Public Records
Tax History Compared to Growth
Tax History
| Year | Tax Paid | Tax Assessment Tax Assessment Total Assessment is a certain percentage of the fair market value that is determined by local assessors to be the total taxable value of land and additions on the property. | Land | Improvement |
|---|---|---|---|---|
| 2024 | $2,710 | $34,210 | $22,380 | $11,830 |
| 2023 | $2,651 | $34,210 | $22,380 | $11,830 |
| 2022 | $2,681 | $33,710 | $22,270 | $11,440 |
| 2021 | $2,588 | $34,680 | $22,910 | $11,770 |
| 2020 | $2,455 | $33,090 | $18,820 | $14,270 |
| 2019 | $2,386 | $33,090 | $18,820 | $14,270 |
| 2018 | $2,053 | $26,540 | $16,480 | $10,060 |
| 2017 | $2,047 | $26,540 | $16,480 | $10,060 |
| 2016 | $1,700 | $20,850 | $15,482 | $5,368 |
| 2015 | $1,629 | $20,850 | $15,482 | $5,368 |
| 2014 | $1,399 | $16,850 | $10,929 | $5,921 |
Source: Public Records
Map
Nearby Homes
- 2000 S Ogden St
- 2056 S Ogden St
- 2033 S Ogden St
- 1925 S Corona St
- 1300 S Corona St
- 2117 S Lafayette St
- 2195 S Downing St
- 2176 S Emerson St
- 2035 S Humboldt St
- 2060 S Washington St
- 2042 S Humboldt St
- 2121 S Humboldt St
- 2232 S Ogden St
- 1928 S Washington St
- 2175 S Clarkson St
- 2011 S Franklin St
- 2250 S Ogden St
- 2140 S Washington St
- 2264 S Corona St
- 2016 S Franklin St
- 2025 S Downing St
- 2041 S Downing St
- 2043 S Downing St
- 2019 S Downing St
- 2047 S Downing St
- 2051 S Downing St
- 2009 S Downing St
- 2030 S Downing St
- 2053 S Downing St
- 2036 S Corona St
- 2040 S Corona St
- 2014 S Downing St
- 2028 S Corona St
- 2022 S Corona St
- 2012 S Downing St
- 2014 S Corona St
- 2008 S Downing St
- 2010 S Downing St
- 2069 S Downing St
- 1238 E Asbury Ave