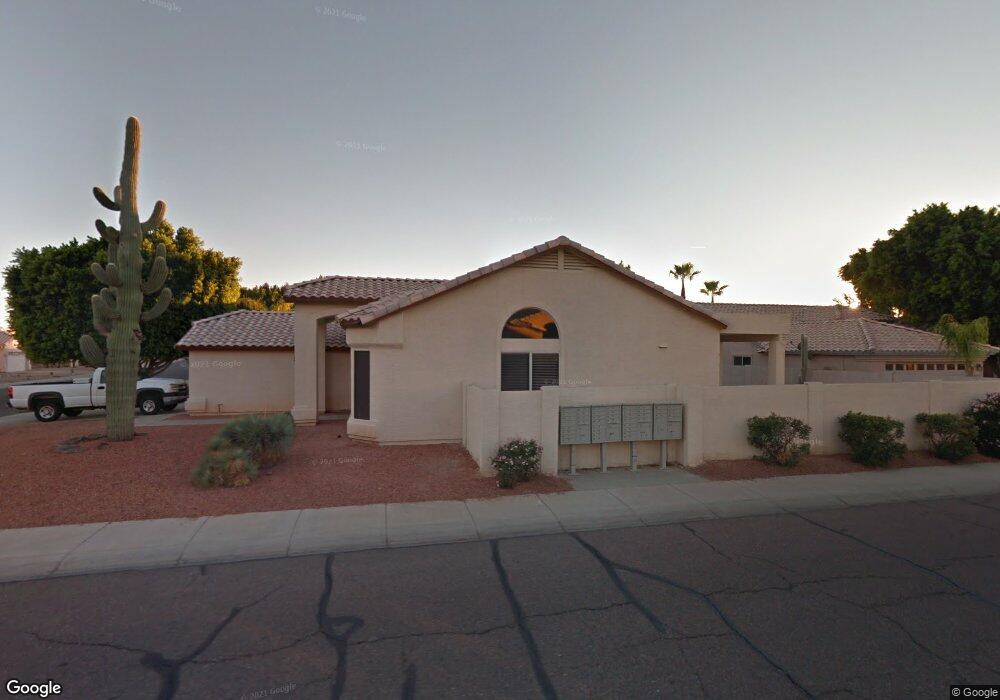
20396 N 52nd Ave Glendale, AZ 85308
Arrowhead NeighborhoodEstimated Value: $487,377 - $631,000
--
Bed
3
Baths
1,605
Sq Ft
$337/Sq Ft
Est. Value
About This Home
This home is located at 20396 N 52nd Ave, Glendale, AZ 85308 and is currently estimated at $541,344, approximately $337 per square foot. 20396 N 52nd Ave is a home located in Maricopa County with nearby schools including Legend Springs Elementary School, Hillcrest Middle School, and Mountain Ridge High School.
Ownership History
Date
Name
Owned For
Owner Type
Purchase Details
Closed on
Jan 4, 2021
Sold by
Manring Mickey L
Bought by
Manring Mickey L and Steele-Borrelli Lynette A
Current Estimated Value
Purchase Details
Closed on
Jan 3, 2017
Sold by
Manring Mickey L
Bought by
Manring Mickey L
Purchase Details
Closed on
Apr 1, 2016
Sold by
Manring Mickey L
Bought by
Manring Mickey L
Purchase Details
Closed on
Oct 7, 2004
Sold by
Perfect Carla J and Manring Carla J
Bought by
Manring Mickey L
Purchase Details
Closed on
Nov 28, 1995
Sold by
First American Title Insurance Company
Bought by
Manring Mickey L and Manring Carla J
Home Financials for this Owner
Home Financials are based on the most recent Mortgage that was taken out on this home.
Original Mortgage
$93,350
Interest Rate
7.42%
Mortgage Type
New Conventional
Create a Home Valuation Report for This Property
The Home Valuation Report is an in-depth analysis detailing your home's value as well as a comparison with similar homes in the area
Home Values in the Area
Average Home Value in this Area
Purchase History
| Date | Buyer | Sale Price | Title Company |
|---|---|---|---|
| Manring Mickey L | -- | None Listed On Document | |
| Manring Mickey L | -- | None Available | |
| Manring Mickey L | -- | None Available | |
| Manring Mickey L | -- | -- | |
| Manring Mickey L | $118,140 | First American Title |
Source: Public Records
Mortgage History
| Date | Status | Borrower | Loan Amount |
|---|---|---|---|
| Previous Owner | Manring Mickey L | $93,350 |
Source: Public Records
Tax History Compared to Growth
Tax History
| Year | Tax Paid | Tax Assessment Tax Assessment Total Assessment is a certain percentage of the fair market value that is determined by local assessors to be the total taxable value of land and additions on the property. | Land | Improvement |
|---|---|---|---|---|
| 2025 | $2,506 | $31,145 | -- | -- |
| 2024 | $2,484 | $29,662 | -- | -- |
| 2023 | $2,484 | $39,560 | $7,910 | $31,650 |
| 2022 | $2,419 | $29,770 | $5,950 | $23,820 |
| 2021 | $2,550 | $28,200 | $5,640 | $22,560 |
| 2020 | $2,522 | $24,470 | $4,890 | $19,580 |
| 2019 | $2,459 | $25,360 | $5,070 | $20,290 |
| 2018 | $2,398 | $23,960 | $4,790 | $19,170 |
| 2017 | $2,333 | $22,700 | $4,540 | $18,160 |
| 2016 | $2,214 | $21,830 | $4,360 | $17,470 |
| 2015 | $2,052 | $20,980 | $4,190 | $16,790 |
Source: Public Records
Map
Nearby Homes
- 20283 N 51st Dr Unit 8B
- 5153 W Pontiac Dr
- 20390 N 54th Ave
- 20615 N 55th Ave
- 21004 N 53rd Ave
- 5415 W Pontiac Dr
- 20391 N 55th Dr
- 20045 N 49th Dr
- 5561 W Rose Garden Ln
- 4918 W Wahalla Ln Unit 1
- 19814 N 49th Dr
- 5344 W Oraibi Dr
- 19731 N 55th Ave
- 4932 W Oraibi Dr
- 4760 W Wahalla Ln
- 4759 W Marco Polo Rd
- 21480 N 56th Ave
- 19519 N 53rd Dr
- 5812 W Del Lago Cir
- 5340 W Melinda Ln
- 20392 N 52nd Ave
- 5215 W Tonopah Dr
- 20388 N 52nd Ave Unit 7B
- 5210 W Tonopah Dr
- 5219 W Tonopah Dr
- 5214 W Tonopah Dr
- 5190 W Tonopah Dr
- 20393 N 52nd Ave
- 20389 N 52nd Ave
- 5218 W Tonopah Dr
- 5186 W Tonopah Dr Unit 7B
- 5223 W Tonopah Dr
- 20385 N 52nd Ave
- 5222 W Tonopah Dr
- 20380 N 52nd Ave
- 20381 N 52nd Ave
- 5227 W Tonopah Dr Unit 7B
- 5226 W Tonopah Dr
- 20377 N 52nd Ave
- 20376 N 52nd Ave