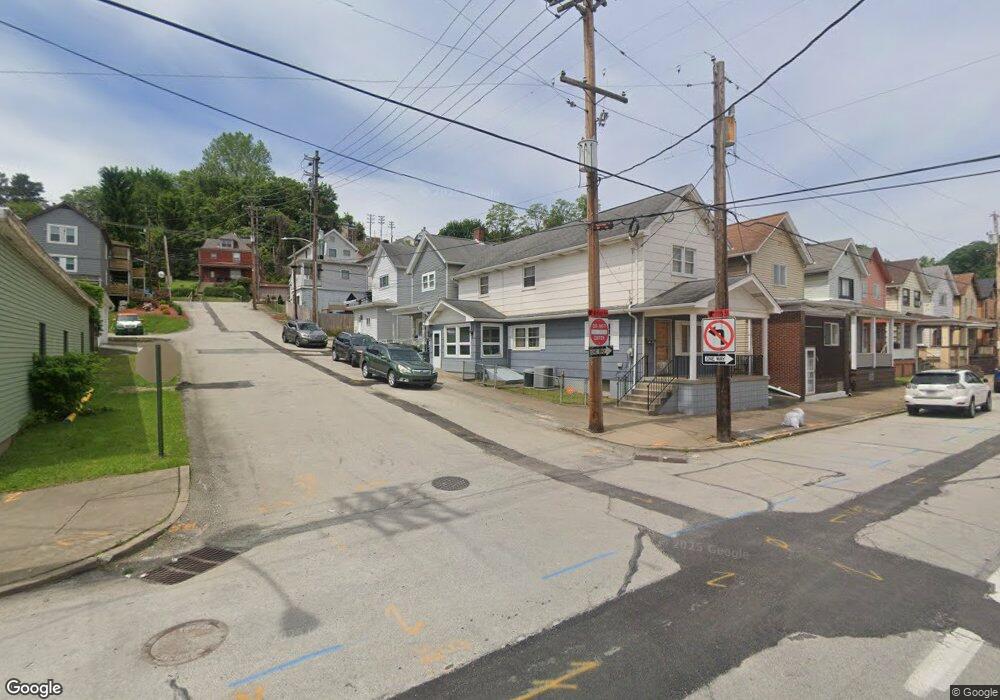
204 11th St Charleroi, PA 15022
Estimated Value: $129,000 - $170,000
4
Beds
2
Baths
1,664
Sq Ft
$91/Sq Ft
Est. Value
About This Home
This home is located at 204 11th St, Charleroi, PA 15022 and is currently estimated at $151,320, approximately $90 per square foot. 204 11th St is a home with nearby schools including Charleroi Elementary Center, Charleroi Area Middle School, and Charleroi Area High School.
Ownership History
Date
Name
Owned For
Owner Type
Purchase Details
Closed on
Feb 15, 2023
Sold by
Valley Dream Homes Llc
Bought by
Sheikhzadeh Shahab Shawn
Current Estimated Value
Home Financials for this Owner
Home Financials are based on the most recent Mortgage that was taken out on this home.
Original Mortgage
$112,800
Outstanding Balance
$109,144
Interest Rate
6.15%
Mortgage Type
New Conventional
Estimated Equity
$42,176
Purchase Details
Closed on
Jun 23, 2016
Sold by
Washington Cnty Tax Claim Bureau
Bought by
Valley Dream Homes Llc
Purchase Details
Closed on
Sep 16, 2005
Sold by
Smith Dorothy F
Bought by
Eicholtz Ida P
Create a Home Valuation Report for This Property
The Home Valuation Report is an in-depth analysis detailing your home's value as well as a comparison with similar homes in the area
Home Values in the Area
Average Home Value in this Area
Purchase History
| Date | Buyer | Sale Price | Title Company |
|---|---|---|---|
| Sheikhzadeh Shahab Shawn | -- | -- | |
| Valley Dream Homes Llc | $5,500 | None Available | |
| Eicholtz Ida P | $10,000 | -- |
Source: Public Records
Mortgage History
| Date | Status | Borrower | Loan Amount |
|---|---|---|---|
| Open | Sheikhzadeh Shahab Shawn | $112,800 |
Source: Public Records
Tax History Compared to Growth
Tax History
| Year | Tax Paid | Tax Assessment Tax Assessment Total Assessment is a certain percentage of the fair market value that is determined by local assessors to be the total taxable value of land and additions on the property. | Land | Improvement |
|---|---|---|---|---|
| 2025 | $3,345 | $106,100 | $7,500 | $98,600 |
| 2024 | $2,941 | $106,100 | $7,500 | $98,600 |
| 2023 | $2,941 | $106,100 | $7,500 | $98,600 |
| 2022 | $1,136 | $42,300 | $7,500 | $34,800 |
| 2021 | $1,136 | $42,300 | $7,500 | $34,800 |
| 2020 | $1,109 | $42,300 | $7,500 | $34,800 |
| 2019 | $1,060 | $42,300 | $7,500 | $34,800 |
| 2018 | $998 | $42,300 | $7,500 | $34,800 |
| 2017 | $107 | $42,300 | $7,500 | $34,800 |
| 2016 | $107 | $4,299 | $366 | $3,933 |
| 2015 | -- | $4,299 | $366 | $3,933 |
| 2014 | $107 | $4,299 | $366 | $3,933 |
| 2013 | $107 | $4,299 | $366 | $3,933 |
Source: Public Records
Map
Nearby Homes