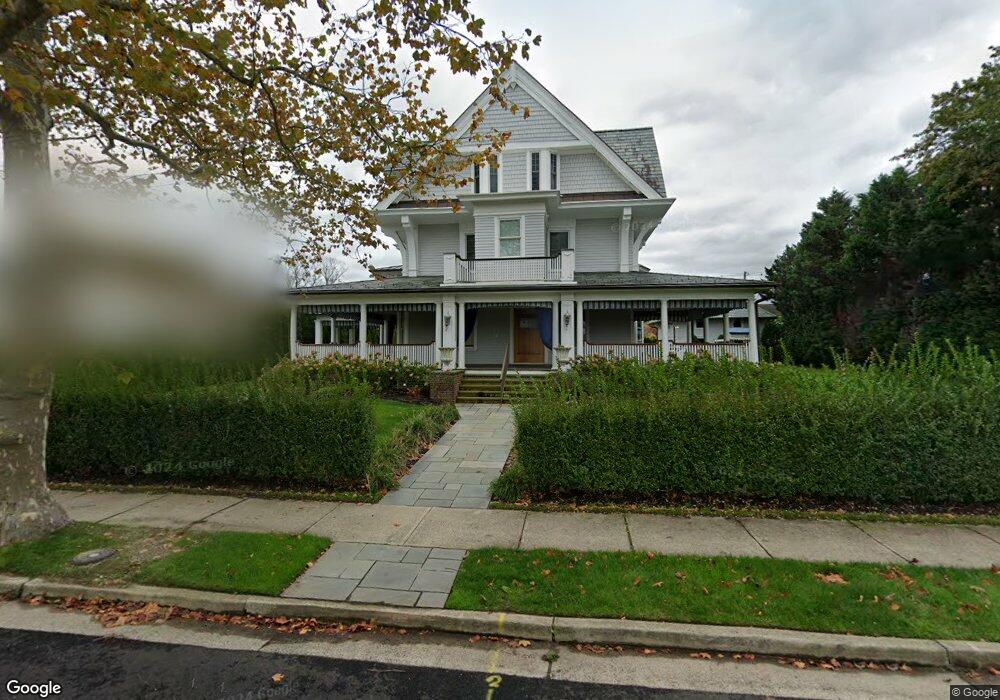
204 Allen Ave Allenhurst, NJ 07711
Estimated Value: $5,072,359 - $5,663,000
9
Beds
5
Baths
5,534
Sq Ft
$953/Sq Ft
Est. Value
About This Home
This home is located at 204 Allen Ave, Allenhurst, NJ 07711 and is currently estimated at $5,274,786, approximately $953 per square foot. 204 Allen Ave is a home located in Monmouth County with nearby schools including Hope Academy Charter School and St. Mary of the Assumption School.
Ownership History
Date
Name
Owned For
Owner Type
Purchase Details
Closed on
Dec 30, 2020
Sold by
Stein Martin and Stein Arlyne
Bought by
Jemal Ezra and Jemal Jennifer
Current Estimated Value
Purchase Details
Closed on
Mar 30, 2009
Sold by
204 Shore Llc
Bought by
Stein Martin and Stein Arlyne
Purchase Details
Closed on
Nov 10, 2006
Sold by
Caulfield Joseph
Bought by
204 Shore Llc
Home Financials for this Owner
Home Financials are based on the most recent Mortgage that was taken out on this home.
Original Mortgage
$2,000,000
Interest Rate
6.39%
Mortgage Type
Purchase Money Mortgage
Purchase Details
Closed on
Apr 1, 2005
Sold by
Eileen Pierson As Exrx Of Est
Bought by
Caulfield Joseph
Create a Home Valuation Report for This Property
The Home Valuation Report is an in-depth analysis detailing your home's value as well as a comparison with similar homes in the area
Home Values in the Area
Average Home Value in this Area
Purchase History
| Date | Buyer | Sale Price | Title Company |
|---|---|---|---|
| Jemal Ezra | -- | None Available | |
| Stein Martin | $3,050,000 | Coastal Title Agency Inc | |
| 204 Shore Llc | -- | -- | |
| Caulfield Joseph | $2,650,000 | -- |
Source: Public Records
Mortgage History
| Date | Status | Borrower | Loan Amount |
|---|---|---|---|
| Previous Owner | 204 Shore Llc | $2,000,000 |
Source: Public Records
Tax History Compared to Growth
Tax History
| Year | Tax Paid | Tax Assessment Tax Assessment Total Assessment is a certain percentage of the fair market value that is determined by local assessors to be the total taxable value of land and additions on the property. | Land | Improvement |
|---|---|---|---|---|
| 2025 | $20,070 | $3,586,000 | $2,305,100 | $1,280,900 |
| 2024 | $21,216 | $3,407,500 | $2,135,200 | $1,272,300 |
| 2023 | $21,216 | $3,400,000 | $2,144,800 | $1,255,200 |
| 2022 | $24,933 | $3,734,400 | $1,823,700 | $1,910,700 |
| 2021 | $24,933 | $3,293,600 | $1,594,100 | $1,699,500 |
| 2020 | $24,562 | $3,105,200 | $1,471,800 | $1,633,400 |
| 2019 | $23,358 | $2,938,100 | $1,314,100 | $1,624,000 |
| 2018 | $22,786 | $2,862,500 | $1,314,100 | $1,548,400 |
| 2017 | $21,111 | $2,713,500 | $1,250,100 | $1,463,400 |
| 2016 | $20,859 | $2,507,100 | $1,147,600 | $1,359,500 |
| 2015 | $20,326 | $2,204,600 | $1,024,700 | $1,179,900 |
| 2014 | $22,414 | $2,636,900 | $1,185,200 | $1,451,700 |
Source: Public Records
Map
Nearby Homes
- 205 Edgemont Dr Unit 3
- 205 Edgemont Dr Unit 1
- 222 Cedar Ave
- 309 Hume St
- 312 Hume St
- 127 Cedar Ave
- 15 Buena Vista Ct
- 309 Spier Ave
- 48 Neptune Ave
- 400 Deal Lake Dr Unit 3J
- 400 Deal Lake Dr Unit 8F
- 400 Deal Lake Dr Unit 3K
- 400 Deal Lake Dr Unit 4G
- 400 Deal Lake Dr Unit 5F
- 400 Deal Lake Dr Unit 7H & 7G
- 400 Deal Lake Dr Unit 7J
- 400 Deal Lake Dr Unit 3F
- 500 Deal Lake Dr Unit 1E
- 500 Deal Lake Dr Unit 3B
- 104 Lake Dr
- 210 Allen Ave
- 55 Norwood Ave S
- 214 Allen Ave
- 209 Elberon Ave
- 45 Norwood Ave S
- 207 Allen Ave
- 203 Allen Ave
- 216 Allen Ave
- 215 Elberon Ave
- 118 Allen Ave
- 211 Allen Ave
- 42 Norwood Ave S
- 44 Norwood Ave S
- 218 Allen Ave
- 309 Norwood Ave S
- 204 Corlies Ave
- 208 Corlies Ave
- 218 Elberon Ave
- 212 Corlies Ave
- 223 Elberon Ave