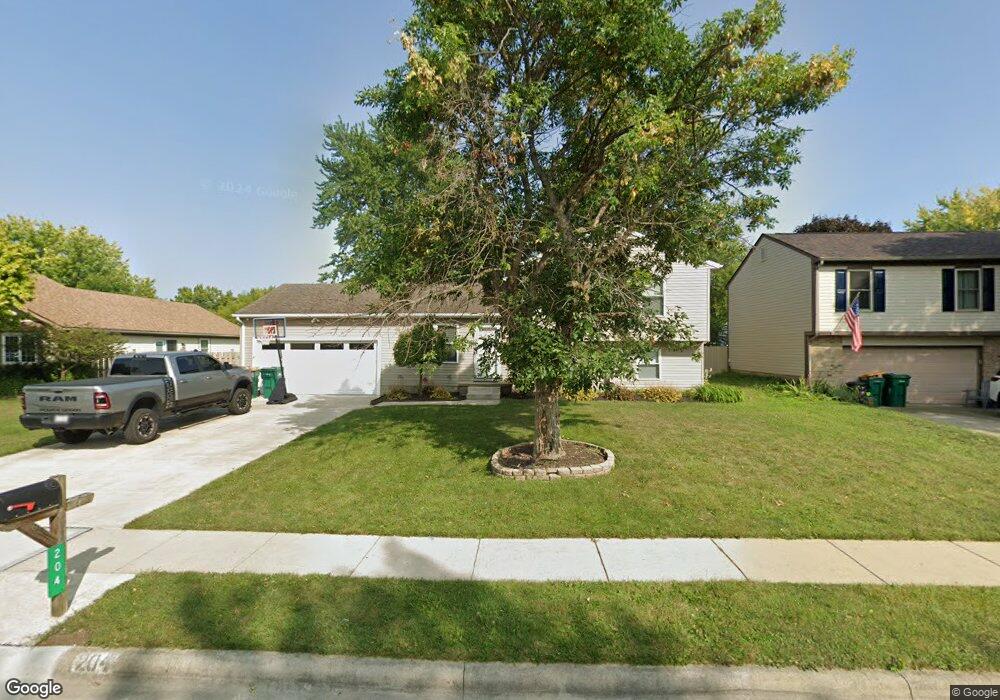
204 Blendon Rd West Jefferson, OH 43162
Estimated Value: $262,000 - $290,000
3
Beds
2
Baths
1,550
Sq Ft
$180/Sq Ft
Est. Value
About This Home
This home is located at 204 Blendon Rd, West Jefferson, OH 43162 and is currently estimated at $278,290, approximately $179 per square foot. 204 Blendon Rd is a home located in Madison County with nearby schools including Norwood Elementary School, West Jefferson Middle School, and West Jefferson High School.
Ownership History
Date
Name
Owned For
Owner Type
Purchase Details
Closed on
Sep 30, 2003
Sold by
Fox Michelle L and Fox Steven
Bought by
Thiel Belinda J and Dunn Christopher B
Current Estimated Value
Home Financials for this Owner
Home Financials are based on the most recent Mortgage that was taken out on this home.
Original Mortgage
$127,988
Outstanding Balance
$60,504
Interest Rate
6.4%
Mortgage Type
FHA
Estimated Equity
$217,786
Purchase Details
Closed on
Sep 3, 1998
Sold by
Edwards Chiquita
Bought by
Fox Michelle L
Home Financials for this Owner
Home Financials are based on the most recent Mortgage that was taken out on this home.
Original Mortgage
$99,288
Interest Rate
7.04%
Mortgage Type
FHA
Purchase Details
Closed on
Aug 4, 1995
Sold by
Vickers Sue A
Bought by
Edwards Chiquita G
Home Financials for this Owner
Home Financials are based on the most recent Mortgage that was taken out on this home.
Original Mortgage
$89,059
Interest Rate
7.56%
Mortgage Type
FHA
Create a Home Valuation Report for This Property
The Home Valuation Report is an in-depth analysis detailing your home's value as well as a comparison with similar homes in the area
Home Values in the Area
Average Home Value in this Area
Purchase History
| Date | Buyer | Sale Price | Title Company |
|---|---|---|---|
| Thiel Belinda J | $129,000 | -- | |
| Fox Michelle L | $99,900 | -- | |
| Edwards Chiquita G | $90,900 | -- |
Source: Public Records
Mortgage History
| Date | Status | Borrower | Loan Amount |
|---|---|---|---|
| Open | Thiel Belinda J | $127,988 | |
| Previous Owner | Fox Michelle L | $99,288 | |
| Previous Owner | Edwards Chiquita G | $89,059 |
Source: Public Records
Tax History Compared to Growth
Tax History
| Year | Tax Paid | Tax Assessment Tax Assessment Total Assessment is a certain percentage of the fair market value that is determined by local assessors to be the total taxable value of land and additions on the property. | Land | Improvement |
|---|---|---|---|---|
| 2024 | $3,560 | $80,490 | $17,520 | $62,970 |
| 2023 | $3,560 | $80,490 | $17,520 | $62,970 |
| 2022 | $2,830 | $59,550 | $13,480 | $46,070 |
| 2021 | $2,841 | $59,550 | $13,480 | $46,070 |
| 2020 | $2,892 | $59,550 | $13,480 | $46,070 |
| 2019 | $2,539 | $51,500 | $12,250 | $39,250 |
| 2018 | $2,361 | $51,500 | $12,250 | $39,250 |
| 2017 | $2,364 | $51,500 | $12,250 | $39,250 |
| 2016 | $2,121 | $45,270 | $12,250 | $33,020 |
| 2015 | $2,212 | $45,270 | $12,250 | $33,020 |
| 2014 | $2,212 | $45,270 | $12,250 | $33,020 |
| 2013 | -- | $37,460 | $12,460 | $25,000 |
Source: Public Records
Map
Nearby Homes
- 1000 W Main St Unit 120
- 622 Brookdale Dr
- 0 W Jeff Kiousville Rd Unit 225000725
- 700 Shawn Dr Unit 88
- 304 Middle Dr
- 63 Jones St
- 125 Dogwood Ct
- 1890 Wilson Rd SE
- 360 State Route 142 NE
- 10763 Southwood Rd
- 3150 Middle Pike
- 8873 Canoe Dr
- 8629 Canyon Cove Rd
- 8830 Hubbard Dr N
- 8548 Canyon Cove Rd
- 3980 Us-40
- 9519 High Free Pike
- 749 Hubbard Rd
- 8482 Dover Crest Ct
- 2915 US Highway 42 NE