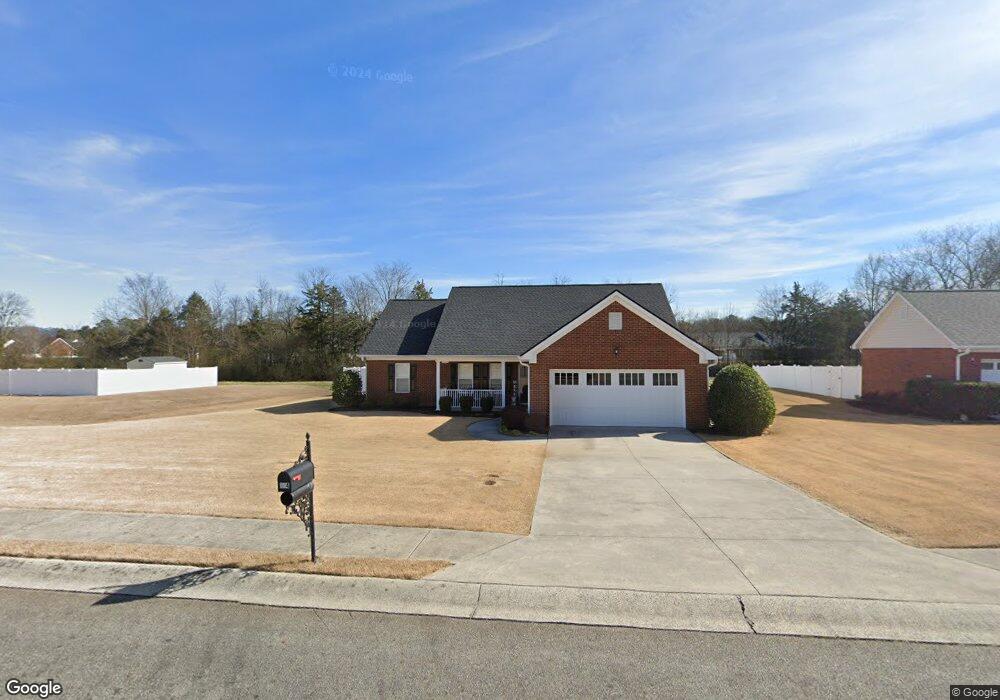
204 Brookstone Dr SW Calhoun, GA 30701
Estimated Value: $273,939 - $292,000
3
Beds
2
Baths
1,497
Sq Ft
$192/Sq Ft
Est. Value
About This Home
This home is located at 204 Brookstone Dr SW, Calhoun, GA 30701 and is currently estimated at $287,235, approximately $191 per square foot. 204 Brookstone Dr SW is a home located in Gordon County with nearby schools including Calhoun Primary School, Calhoun Elementary School, and Calhoun Middle School.
Ownership History
Date
Name
Owned For
Owner Type
Purchase Details
Closed on
Apr 13, 2018
Sold by
Erwin Timothy Lane
Bought by
Erwin Timothy Lane and Erwin Donna Charlene
Current Estimated Value
Home Financials for this Owner
Home Financials are based on the most recent Mortgage that was taken out on this home.
Original Mortgage
$137,270
Outstanding Balance
$118,539
Interest Rate
4.62%
Mortgage Type
FHA
Estimated Equity
$168,696
Purchase Details
Closed on
Feb 20, 2015
Sold by
Roberson Jeremy
Bought by
King Sandra A and Dawkins Bryan L
Home Financials for this Owner
Home Financials are based on the most recent Mortgage that was taken out on this home.
Original Mortgage
$132,551
Interest Rate
3.74%
Mortgage Type
New Conventional
Purchase Details
Closed on
Nov 4, 2014
Sold by
Pass Tammy J
Bought by
Roberson Jeremy
Purchase Details
Closed on
Aug 27, 2003
Sold by
Calhoun Realty & Development Co Inc
Bought by
Pass Tammy J
Create a Home Valuation Report for This Property
The Home Valuation Report is an in-depth analysis detailing your home's value as well as a comparison with similar homes in the area
Home Values in the Area
Average Home Value in this Area
Purchase History
| Date | Buyer | Sale Price | Title Company |
|---|---|---|---|
| Erwin Timothy Lane | -- | -- | |
| Erwin Timothy Lane | $149,900 | -- | |
| King Sandra A | $129,900 | -- | |
| Roberson Jeremy | $94,500 | -- | |
| Pass Tammy J | $116,900 | -- |
Source: Public Records
Mortgage History
| Date | Status | Borrower | Loan Amount |
|---|---|---|---|
| Open | Erwin Timothy Lane | $137,270 | |
| Closed | Erwin Timothy Lane | $137,270 | |
| Previous Owner | King Sandra A | $132,551 |
Source: Public Records
Tax History Compared to Growth
Tax History
| Year | Tax Paid | Tax Assessment Tax Assessment Total Assessment is a certain percentage of the fair market value that is determined by local assessors to be the total taxable value of land and additions on the property. | Land | Improvement |
|---|---|---|---|---|
| 2024 | $2,624 | $93,320 | $5,200 | $88,120 |
| 2023 | $2,447 | $87,040 | $5,200 | $81,840 |
| 2022 | $772 | $81,160 | $5,200 | $75,960 |
| 2021 | $1,991 | $66,880 | $7,000 | $59,880 |
| 2020 | $1,863 | $62,080 | $7,000 | $55,080 |
| 2019 | $1,797 | $62,080 | $7,000 | $55,080 |
| 2018 | $533 | $57,320 | $7,000 | $50,320 |
| 2017 | $515 | $54,400 | $7,000 | $47,400 |
| 2016 | $492 | $54,400 | $7,000 | $47,400 |
| 2015 | $513 | $53,400 | $7,000 | $46,400 |
| 2014 | $484 | $51,116 | $7,000 | $44,116 |
Source: Public Records
Map
Nearby Homes
- 130 Brookstone Dr SW
- 137 Regency Row SW
- 121 Overland Dr SW
- 121 Foxhall Dr SW
- 413 Beamer Rd SW
- 494 Lakecrest Cir SW
- 210 Madison Dr SW
- The Braselton II Plan at Fair Oak
- The Reynolds Plan at Fair Oak
- The Buford II Plan at Fair Oak
- The Lawson Plan at Fair Oak
- The Caldwell Plan at Fair Oak
- The Benson II Plan at Fair Oak
- The Greenbrier II Plan at Fair Oak
- 0 Highway 53 Spur SW Unit 7529096
- 215 Wilson St
- 227 Mcconnell Rd
- 00 Belmont Dr
- 100 Neal St
- 85 Professional Place Unit 14
- 206 Brookstone Dr SW
- 202 Brookstone Dr SW
- 208 Brookstone Dr SW
- 205 Brookstone Dr SW
- 203 Brookstone Dr SW
- 207 Brookstone Dr SW
- 201 Brookstone Dr SW
- 205 Patriots Row SW
- 210 Brookstone Dr SW
- 209 Patriots Row SW
- 209 Brookstone Dr SW
- 211 Patriots Row SW
- 201 Patriots Row SW
- 302 Hillside Dr SW
- 134 Brookstone Dr SW
- 211 Brookstone Dr SW
- 306 Hillside Dr SW
- 131 Brookstone Dr SW
- 304 Hillside Dr SW
- 0 Hillside Dr SW