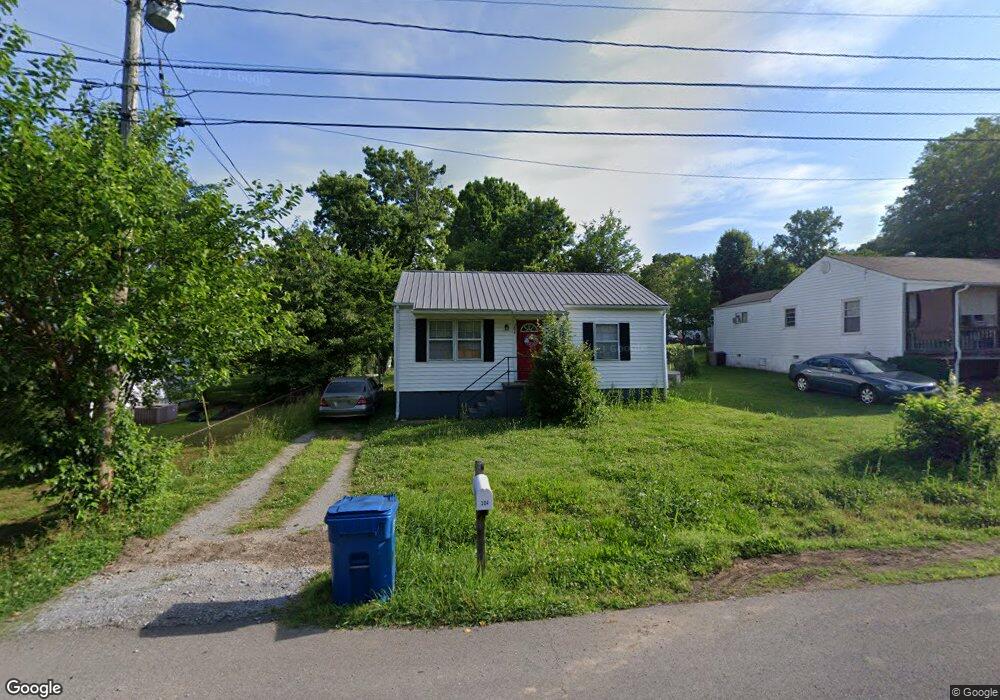
204 Cave St Rossville, GA 30741
Estimated Value: $118,000 - $141,035
2
Beds
1
Bath
720
Sq Ft
$184/Sq Ft
Est. Value
About This Home
This home is located at 204 Cave St, Rossville, GA 30741 and is currently estimated at $132,759, approximately $184 per square foot. 204 Cave St is a home located in Walker County with nearby schools including Rossville Elementary School, Rossville Middle School, and Ridgeland High School.
Ownership History
Date
Name
Owned For
Owner Type
Purchase Details
Closed on
Nov 8, 2019
Sold by
Voss Carroll Gene
Bought by
Voss Paul Everett
Current Estimated Value
Purchase Details
Closed on
Aug 9, 2017
Sold by
Williams Nettie Carolyn
Bought by
Voss Paul Everett and Voss Carroll Gene
Purchase Details
Closed on
Dec 16, 1998
Sold by
Hall Mildred
Bought by
Williams Nettie Carolyn
Purchase Details
Closed on
May 18, 1976
Sold by
Administrator Of Veterans Affa
Bought by
Hall Mildred
Purchase Details
Closed on
Jun 10, 1975
Sold by
Federal National Mortgage Asso
Bought by
Administrator Of Veterans Affa
Purchase Details
Closed on
Jun 3, 1975
Sold by
Clark Roger Dale
Bought by
Federal National Mortgage Asso
Purchase Details
Closed on
Sep 9, 1974
Sold by
Jones Dana L and Jones Wf
Bought by
Clark Roger Dale
Purchase Details
Closed on
Aug 25, 1974
Sold by
Murray Gary G
Bought by
Jones Dana L and Jones Wf
Purchase Details
Closed on
Apr 26, 1974
Bought by
Murray Gary G
Create a Home Valuation Report for This Property
The Home Valuation Report is an in-depth analysis detailing your home's value as well as a comparison with similar homes in the area
Home Values in the Area
Average Home Value in this Area
Purchase History
| Date | Buyer | Sale Price | Title Company |
|---|---|---|---|
| Voss Paul Everett | -- | -- | |
| Voss Paul Everett | $35,000 | -- | |
| Williams Nettie Carolyn | -- | -- | |
| Hall Mildred | $11,500 | -- | |
| Administrator Of Veterans Affa | -- | -- | |
| Federal National Mortgage Asso | -- | -- | |
| Clark Roger Dale | -- | -- | |
| Jones Dana L | -- | -- | |
| Murray Gary G | -- | -- |
Source: Public Records
Tax History Compared to Growth
Tax History
| Year | Tax Paid | Tax Assessment Tax Assessment Total Assessment is a certain percentage of the fair market value that is determined by local assessors to be the total taxable value of land and additions on the property. | Land | Improvement |
|---|---|---|---|---|
| 2024 | $1,522 | $46,603 | $3,360 | $43,243 |
| 2023 | $1,458 | $44,170 | $3,360 | $40,810 |
| 2022 | $745 | $28,291 | $3,360 | $24,931 |
| 2021 | $499 | $17,002 | $2,240 | $14,762 |
| 2020 | $448 | $14,595 | $2,240 | $12,355 |
| 2019 | $448 | $14,595 | $2,240 | $12,355 |
| 2018 | $434 | $14,595 | $2,240 | $12,355 |
| 2017 | $485 | $14,595 | $2,240 | $12,355 |
| 2016 | $294 | $10,664 | $2,240 | $8,424 |
| 2015 | $575 | $19,874 | $3,420 | $16,454 |
| 2014 | $554 | $19,874 | $3,420 | $16,454 |
| 2013 | -- | $19,873 | $3,420 | $16,453 |
Source: Public Records
Map
Nearby Homes
- 806 Mcfarland Ave
- 189 Leinbach Rd
- 115 Beech St
- 405 Miami Ave
- 1204 Wooden Ave
- 136 Summit St
- Lot 81 Battle Bluff Dr
- Lot 80 Battle Bluff Dr
- Lot 79 Battle Bluff Dr
- 916 Logan Ave
- 0 Dempsey Ln Unit 1504691
- 105 Elm St
- 200 W Oak St
- 39 Clift Trail
- 141 Hogan Rd
- 301 Dempsey Ln
- 164 S Mission Ridge Dr
- 1014 Lee Ave
- 4 Carroll Ln