Estimated Value: $279,000 - $307,000
3
Beds
2
Baths
1,361
Sq Ft
$217/Sq Ft
Est. Value
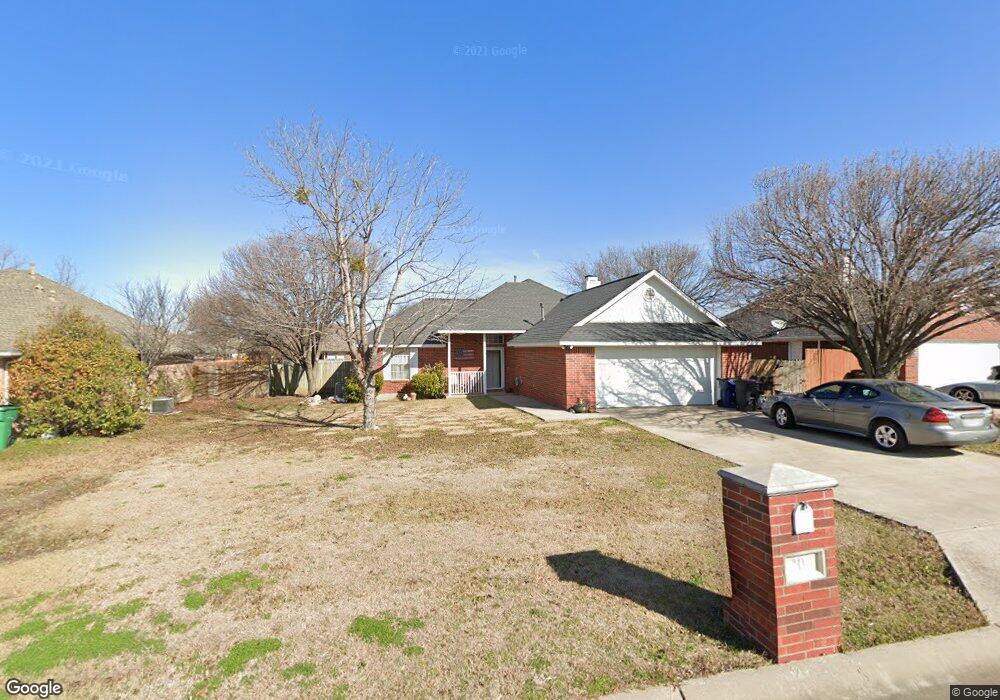
About This Home
This home is located at 204 Dove Meadows, Krum, TX 76249 and is currently estimated at $295,464, approximately $217 per square foot. 204 Dove Meadows is a home located in Denton County with nearby schools including Krum Early Education Center, Blanche Dodd Intermediate School, and Krum Middle School.
Ownership History
Date
Name
Owned For
Owner Type
Purchase Details
Closed on
Dec 18, 2002
Sold by
Thrasher William M and Thrasher Jennifer A
Bought by
Cheek Sabra Michelle
Current Estimated Value
Home Financials for this Owner
Home Financials are based on the most recent Mortgage that was taken out on this home.
Original Mortgage
$23,174
Outstanding Balance
$9,754
Interest Rate
5.96%
Estimated Equity
$285,710
Purchase Details
Closed on
Aug 13, 1998
Sold by
Manning David L
Bought by
David Manning Inc
Home Financials for this Owner
Home Financials are based on the most recent Mortgage that was taken out on this home.
Original Mortgage
$78,320
Interest Rate
6.95%
Purchase Details
Closed on
Mar 26, 1998
Sold by
Edmonds Investments Inc
Bought by
Manning David L
Home Financials for this Owner
Home Financials are based on the most recent Mortgage that was taken out on this home.
Original Mortgage
$71,600
Interest Rate
7.12%
Mortgage Type
Purchase Money Mortgage
Create a Home Valuation Report for This Property
The Home Valuation Report is an in-depth analysis detailing your home's value as well as a comparison with similar homes in the area
Home Values in the Area
Average Home Value in this Area
Purchase History
| Date | Buyer | Sale Price | Title Company |
|---|---|---|---|
| Cheek Sabra Michelle | -- | -- | |
| David Manning Inc | -- | -- | |
| Thrasher William M | -- | -- | |
| Manning David L | -- | -- |
Source: Public Records
Mortgage History
| Date | Status | Borrower | Loan Amount |
|---|---|---|---|
| Open | Cheek Sabra Michelle | $23,174 | |
| Previous Owner | Thrasher William M | $78,320 | |
| Previous Owner | Manning David L | $71,600 | |
| Closed | Cheek Sabra Michelle | $87,177 |
Source: Public Records
Tax History Compared to Growth
Tax History
| Year | Tax Paid | Tax Assessment Tax Assessment Total Assessment is a certain percentage of the fair market value that is determined by local assessors to be the total taxable value of land and additions on the property. | Land | Improvement |
|---|---|---|---|---|
| 2025 | $4,454 | $303,747 | $59,820 | $243,927 |
| 2024 | $5,694 | $282,526 | $0 | $0 |
| 2023 | $3,944 | $256,842 | $59,820 | $234,069 |
| 2022 | $5,356 | $233,493 | $59,820 | $199,456 |
| 2021 | $4,707 | $212,266 | $35,892 | $176,374 |
| 2020 | $4,568 | $201,703 | $35,892 | $165,811 |
| 2019 | $4,835 | $200,366 | $35,892 | $164,474 |
| 2018 | $3,665 | $151,110 | $25,922 | $125,188 |
| 2017 | $3,630 | $149,018 | $25,922 | $123,096 |
| 2016 | $3,614 | $142,089 | $25,922 | $116,167 |
| 2015 | $2,936 | $124,800 | $25,922 | $98,878 |
| 2014 | $2,936 | $119,372 | $25,922 | $93,450 |
| 2013 | -- | $119,526 | $25,922 | $93,604 |
Source: Public Records
Map
Nearby Homes
- 202 Dove Meadows
- 206 Dove Meadows
- 203 Mourning Dove Ln
- 205 Mourning Dove Ln
- 208 Dove Meadows
- 200 Dove Meadows
- 205 Dove Meadows
- 207 Mourning Dove Ln
- 203 Dove Meadows
- 207 Dove Meadows
- 201 Mourning Dove Ln
- 210 Dove Meadows
- 209 Dove Meadows
- 201 Dove Meadows
- 209 Mourning Dove Ln
- 211 Dove Meadows
- 212 Dove Meadows
- 204 Brook Cir
- 202 Brook Cir
- 211 Mourning Dove Ln