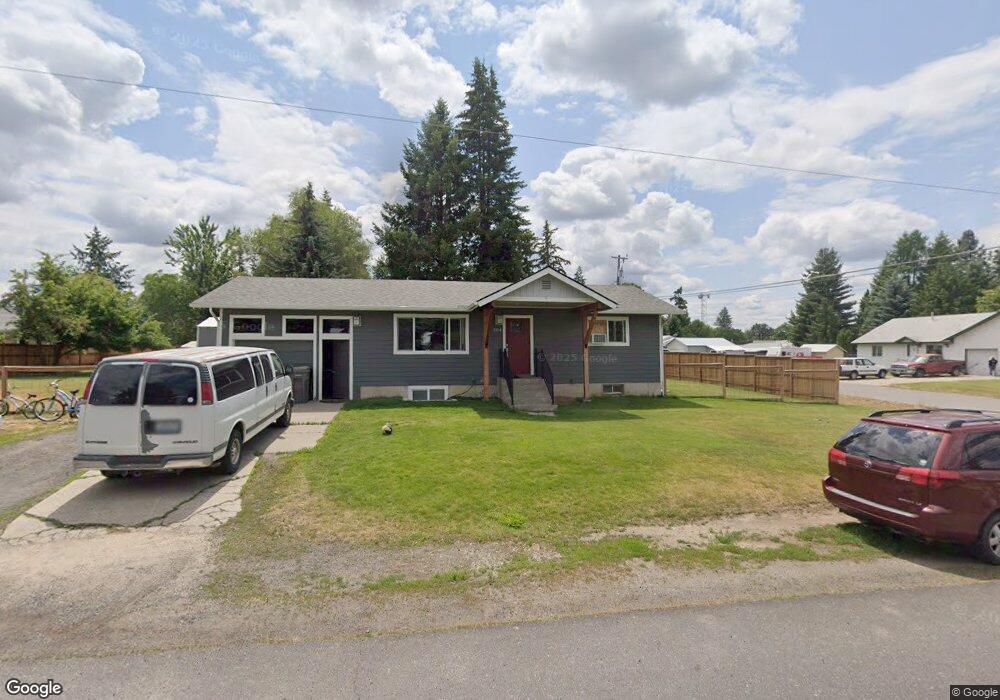
204 E 2nd St Deer Park, WA 99006
Estimated Value: $304,000 - $338,000
3
Beds
1
Bath
864
Sq Ft
$371/Sq Ft
Est. Value
About This Home
This home is located at 204 E 2nd St, Deer Park, WA 99006 and is currently estimated at $320,371, approximately $370 per square foot. 204 E 2nd St is a home with nearby schools including Deer Park Home Link Program, Arcadia Elementary School, and Deer Park Elementary School.
Ownership History
Date
Name
Owned For
Owner Type
Purchase Details
Closed on
Jun 25, 2018
Sold by
Byerly Pauly and Byerly Laura
Bought by
Lever Henry D and Lever Lori
Current Estimated Value
Home Financials for this Owner
Home Financials are based on the most recent Mortgage that was taken out on this home.
Original Mortgage
$146,500
Outstanding Balance
$126,964
Interest Rate
4.5%
Mortgage Type
VA
Estimated Equity
$193,407
Purchase Details
Closed on
Jul 21, 2010
Sold by
The Riggle Living Trust
Bought by
Byerly Pauly and Byerly Laura
Home Financials for this Owner
Home Financials are based on the most recent Mortgage that was taken out on this home.
Original Mortgage
$108,257
Interest Rate
4.68%
Mortgage Type
FHA
Purchase Details
Closed on
Aug 30, 1995
Sold by
Riggle Wilma P
Bought by
Riggle Wilma P and Riggle Living Trust
Create a Home Valuation Report for This Property
The Home Valuation Report is an in-depth analysis detailing your home's value as well as a comparison with similar homes in the area
Home Values in the Area
Average Home Value in this Area
Purchase History
| Date | Buyer | Sale Price | Title Company |
|---|---|---|---|
| Lever Henry D | $146,500 | First Amer Title Ins Co | |
| Byerly Pauly | $68,280 | Stewart Title Of Spokane | |
| Riggle Wilma P | -- | -- |
Source: Public Records
Mortgage History
| Date | Status | Borrower | Loan Amount |
|---|---|---|---|
| Open | Lever Henry D | $146,500 | |
| Previous Owner | Byerly Pauly | $108,257 |
Source: Public Records
Tax History Compared to Growth
Tax History
| Year | Tax Paid | Tax Assessment Tax Assessment Total Assessment is a certain percentage of the fair market value that is determined by local assessors to be the total taxable value of land and additions on the property. | Land | Improvement |
|---|---|---|---|---|
| 2025 | $2,320 | $261,000 | $65,000 | $196,000 |
| 2024 | $2,320 | $262,700 | $60,000 | $202,700 |
| 2023 | $2,001 | $256,800 | $45,000 | $211,800 |
| 2022 | $1,874 | $222,000 | $45,000 | $177,000 |
| 2021 | $1,743 | $157,700 | $40,000 | $117,700 |
| 2020 | $1,709 | $148,100 | $34,500 | $113,600 |
| 2019 | $1,506 | $131,300 | $25,000 | $106,300 |
| 2018 | $1,375 | $110,100 | $25,000 | $85,100 |
| 2017 | $1,270 | $103,400 | $25,000 | $78,400 |
| 2016 | $1,240 | $97,600 | $25,000 | $72,600 |
| 2015 | $1,247 | $95,800 | $25,000 | $70,800 |
| 2014 | -- | $102,800 | $32,000 | $70,800 |
| 2013 | -- | $0 | $0 | $0 |
Source: Public Records
Map
Nearby Homes
- 116 N Arnim Ave
- 212 E 2nd St
- 112 N Arnim Ave
- 115 N Arnim
- 115 N Margaret Ave
- 205 E 1st St
- 208 N Arnim 210
- 219 E 2nd St
- 123 E 1st St
- 215 E 1st St
- 103 N Margaret Ave
- 116 N Margaret Ave
- 111 E 1st St
- 0 E 2nd St
- 204 N Margaret Ave
- 208 E 3rd St
- 106 N Margaret Ave
- 304 E 2nd St
- 106 N Vernon Ave
- 102 N Margaret Ave