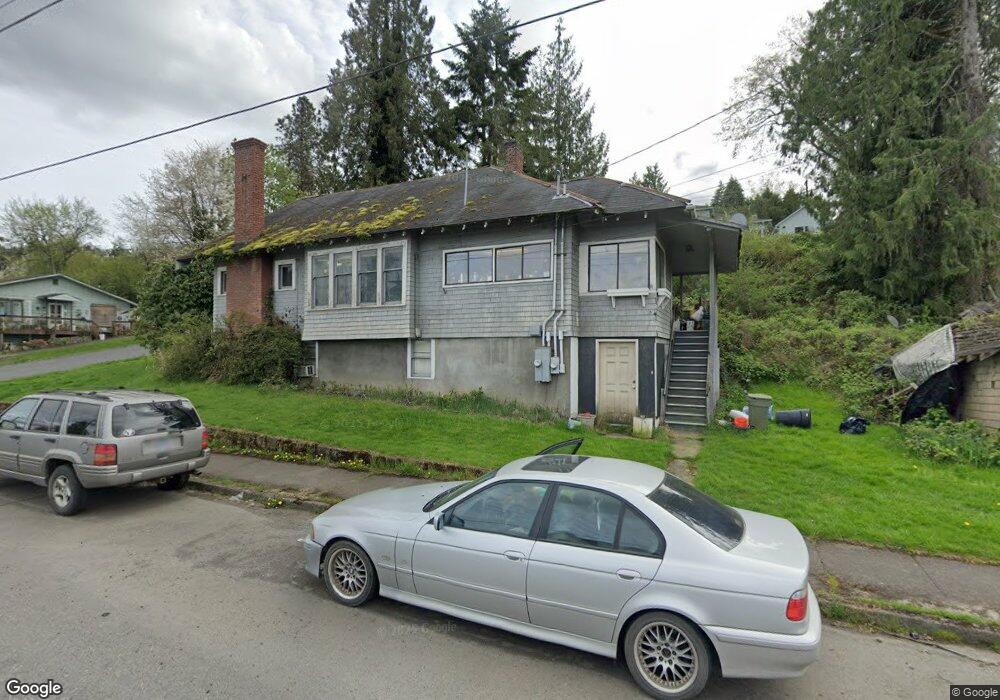
204 E 4th St Rainier, OR 97048
Estimated Value: $287,194 - $394,000
2
Beds
1
Bath
1,288
Sq Ft
$258/Sq Ft
Est. Value
About This Home
This home is located at 204 E 4th St, Rainier, OR 97048 and is currently estimated at $332,549, approximately $258 per square foot. 204 E 4th St is a home with nearby schools including Hudson Park Elementary School, Rainier Junior/Senior High School, and North Columbia Academy.
Ownership History
Date
Name
Owned For
Owner Type
Purchase Details
Closed on
Mar 10, 2005
Sold by
Betts Kenneth C and Betts Crystal
Bought by
Betts Kenneth C and Betts Elizabeth
Current Estimated Value
Home Financials for this Owner
Home Financials are based on the most recent Mortgage that was taken out on this home.
Original Mortgage
$70,000
Outstanding Balance
$35,108
Interest Rate
5.65%
Mortgage Type
Stand Alone Refi Refinance Of Original Loan
Estimated Equity
$297,441
Purchase Details
Closed on
Oct 5, 1999
Bought by
Betts Kenneth C and Betts Elizabeth
Create a Home Valuation Report for This Property
The Home Valuation Report is an in-depth analysis detailing your home's value as well as a comparison with similar homes in the area
Purchase History
| Date | Buyer | Sale Price | Title Company |
|---|---|---|---|
| Betts Kenneth C | -- | Columbia County Title | |
| Betts Kenneth C | $85,000 | -- |
Source: Public Records
Mortgage History
| Date | Status | Borrower | Loan Amount |
|---|---|---|---|
| Open | Betts Kenneth C | $70,000 |
Source: Public Records
Tax History
| Year | Tax Paid | Tax Assessment Tax Assessment Total Assessment is a certain percentage of the fair market value that is determined by local assessors to be the total taxable value of land and additions on the property. | Land | Improvement |
|---|---|---|---|---|
| 2025 | $2,486 | $134,620 | $51,210 | $83,410 |
| 2024 | $2,428 | $130,700 | $49,710 | $80,990 |
| 2023 | $2,395 | $126,900 | $44,200 | $82,700 |
| 2022 | $2,287 | $123,210 | $42,910 | $80,300 |
| 2021 | $2,250 | $119,630 | $41,660 | $77,970 |
| 2020 | $2,186 | $116,150 | $38,140 | $78,010 |
| 2019 | $2,152 | $112,770 | $48,550 | $64,220 |
| 2018 | $2,102 | $109,490 | $46,320 | $63,170 |
| 2017 | $2,082 | $106,310 | $44,970 | $61,340 |
| 2016 | $2,023 | $103,220 | $43,660 | $59,560 |
| 2015 | $1,937 | $100,220 | $44,410 | $55,810 |
| 2014 | $1,858 | $97,310 | $48,200 | $49,110 |
Source: Public Records
Map
Nearby Homes
Your Personal Tour Guide
Ask me questions while you tour the home.