
Seller's Agent in 2025
Miranda Biedenharn
Comey & Shepherd REALTORS
(937) 689-1013
2 in this area
328 Total Sales
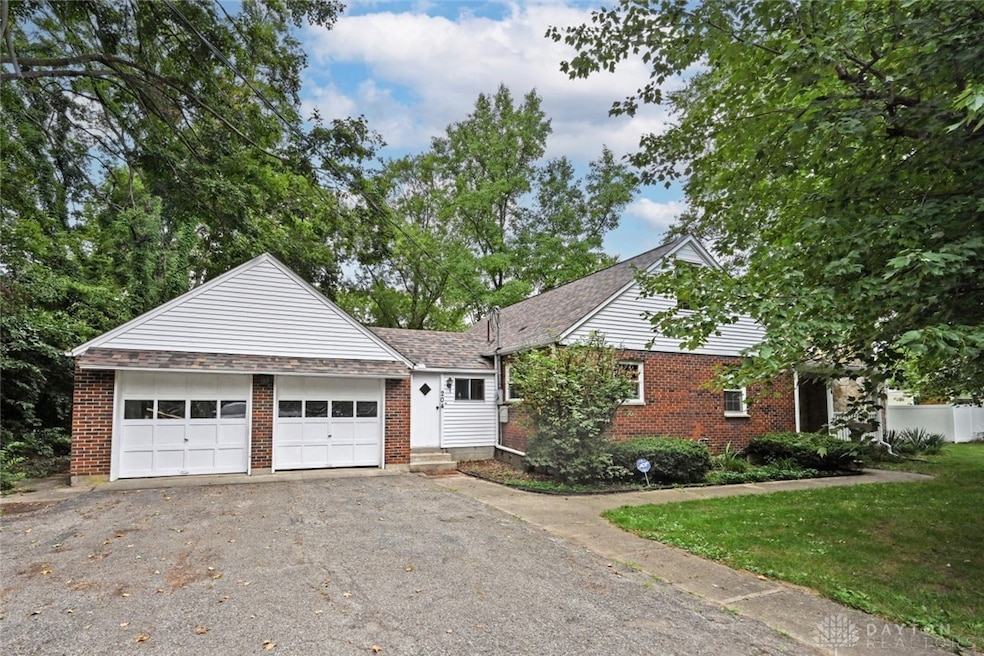
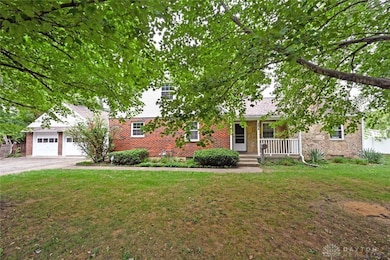
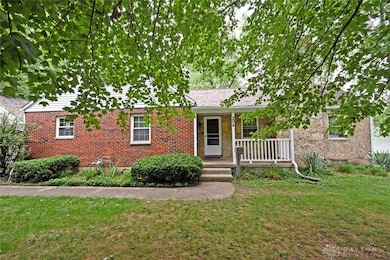
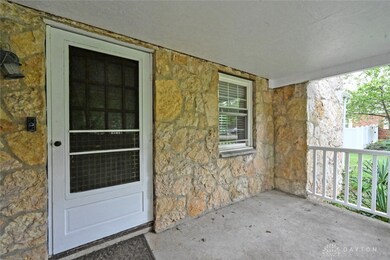
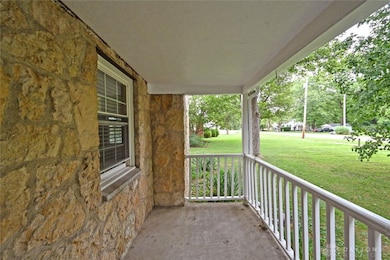
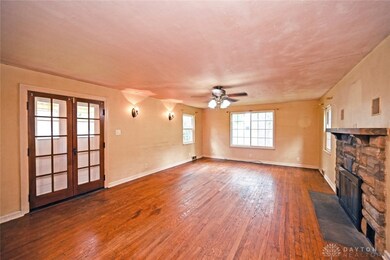
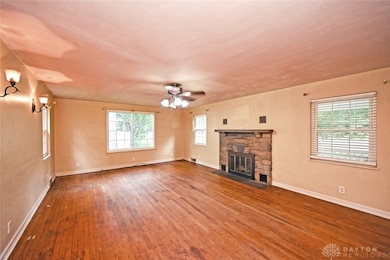
Classic charm meets convenience in this brick Cape Cod with eye-catching stone accents and a flat, private lot in the heart of downtown. Step inside to beautiful hardwood floors, a cozy layout, and all appliances included--making move-in a breeze. The two-car attached garage gives you plenty of space for storage or projects, and the mix of city sewer and well water offers the best of both worlds. Whether you're sipping coffee on the porch or enjoying the peace of your tucked-away lot, this home is full of character and comfort. A solid gem in a central location--come see it before it's gone!
Last Agent to Sell the Property
Comey & Shepherd REALTORS Brokerage Phone: (937) 689-1013 License #2020007923 Listed on: 08/22/2025
| Date | Type | Sale Price | Title Company |
|---|---|---|---|
| Warranty Deed | $128,500 | Performance Title | |
| Warranty Deed | $132,000 | Hallmark Title | |
| Warranty Deed | $127,000 | -- |
| Date | Status | Loan Amount | Loan Type |
|---|---|---|---|
| Previous Owner | $131,262 | VA | |
| Previous Owner | $104,000 | Purchase Money Mortgage | |
| Previous Owner | $101,600 | Purchase Money Mortgage | |
| Closed | $19,000 | No Value Available |
| Date | Event | Price | List to Sale | Price per Sq Ft |
|---|---|---|---|---|
| 12/18/2025 12/18/25 | Sold | $225,000 | -4.3% | $125 / Sq Ft |
| 10/07/2025 10/07/25 | Price Changed | $235,000 | -2.1% | $131 / Sq Ft |
| 08/22/2025 08/22/25 | For Sale | $240,000 | -- | $133 / Sq Ft |
| Year | Tax Paid | Tax Assessment Tax Assessment Total Assessment is a certain percentage of the fair market value that is determined by local assessors to be the total taxable value of land and additions on the property. | Land | Improvement |
|---|---|---|---|---|
| 2025 | $2,658 | $69,580 | $14,230 | $55,350 |
| 2024 | $2,587 | $54,630 | $13,010 | $41,620 |
| 2023 | $2,587 | $54,630 | $13,010 | $41,620 |
| 2022 | $2,599 | $54,630 | $13,010 | $41,620 |
| 2021 | $2,114 | $40,280 | $9,500 | $30,780 |
| 2020 | $2,119 | $40,280 | $9,500 | $30,780 |
| 2019 | $2,133 | $40,280 | $9,500 | $30,780 |
| 2018 | $2,526 | $44,680 | $10,740 | $33,940 |
| 2017 | $2,511 | $44,086 | $10,738 | $33,348 |
| 2016 | $2,407 | $44,086 | $10,738 | $33,348 |
| 2015 | $2,431 | $43,145 | $10,738 | $32,407 |
| 2014 | $2,414 | $43,145 | $10,738 | $32,407 |
| 2013 | $2,416 | $43,145 | $10,738 | $32,407 |
Seller's Agent in 2025
Miranda Biedenharn
Comey & Shepherd REALTORS
(937) 689-1013
2 in this area
328 Total Sales
Buyer's Agent in 2025
Adam Minehart
NavX Realty, LLC
(937) 926-3352
1 in this area
92 Total Sales
Source: Dayton REALTORS®
MLS Number: 942023
APN: 01-00500-01931-0019
Disclaimer: Certain information contained herein is derived from information provided by parties other than Homes.com. All information provided is deemed reliable, but is not guaranteed to be accurate and should be independently verified.
![]() The information is being provided by Dayton Area Board of Realtors MLS. Information deemed reliable but not guaranteed. Information is provided for the consumer's personal, non-commercial use, and may not be used for any purpose other than the identification of potential properties for purchase. Copyright 2026 Dayton Area Board of Realtors MLS. All Rights Reserved.
The information is being provided by Dayton Area Board of Realtors MLS. Information deemed reliable but not guaranteed. Information is provided for the consumer's personal, non-commercial use, and may not be used for any purpose other than the identification of potential properties for purchase. Copyright 2026 Dayton Area Board of Realtors MLS. All Rights Reserved.
Ask me questions while you tour the home.