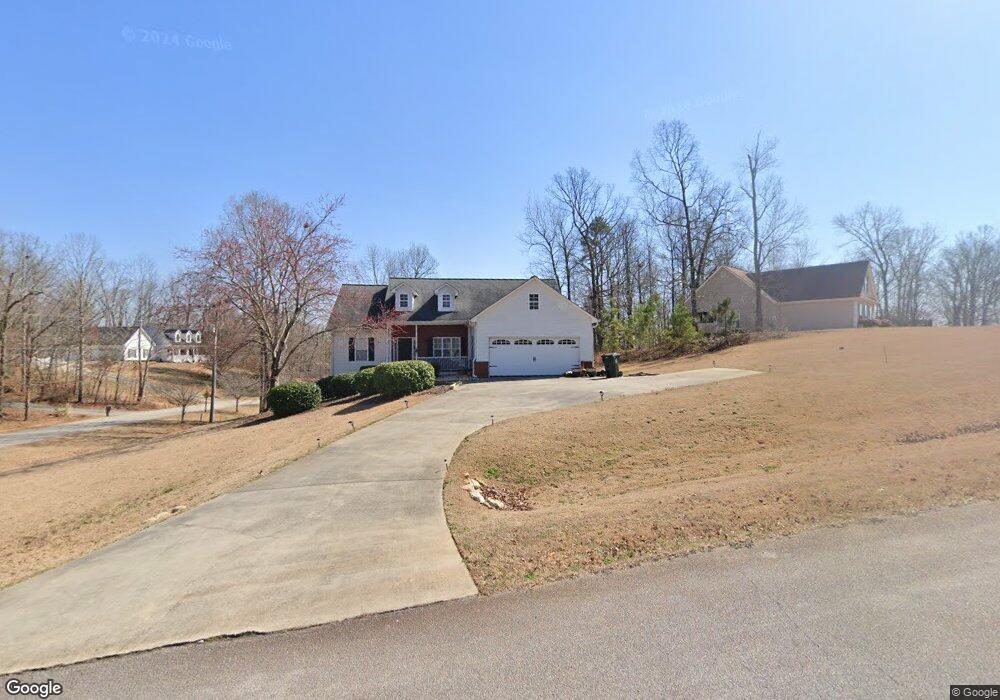
204 Emily Cir Unit 27 Villa Rica, GA 30180
Estimated Value: $283,000 - $305,000
3
Beds
2
Baths
1,499
Sq Ft
$196/Sq Ft
Est. Value
About This Home
This home is located at 204 Emily Cir Unit 27, Villa Rica, GA 30180 and is currently estimated at $294,310, approximately $196 per square foot. 204 Emily Cir Unit 27 is a home located in Carroll County with nearby schools including Glanton-Hindsman Elementary School, Villa Rica Middle School, and Villa Rica High School.
Ownership History
Date
Name
Owned For
Owner Type
Purchase Details
Closed on
Mar 23, 2018
Sold by
Carver Allan
Bought by
Eason Artis Carl and Eason Anita Gwen
Current Estimated Value
Home Financials for this Owner
Home Financials are based on the most recent Mortgage that was taken out on this home.
Original Mortgage
$157,016
Outstanding Balance
$134,614
Interest Rate
4.4%
Mortgage Type
VA
Estimated Equity
$159,696
Purchase Details
Closed on
Mar 28, 2017
Sold by
Morris Gary L
Bought by
Carver Allan
Purchase Details
Closed on
Oct 31, 2001
Sold by
Hunter International
Bought by
Morris Gary L and Morris Mega
Purchase Details
Closed on
Oct 5, 2000
Sold by
Phillips Bobby Dev I
Bought by
Hunter International
Purchase Details
Closed on
May 15, 2000
Sold by
Phillips Bobby E
Bought by
Phillips Bobby Dev I
Purchase Details
Closed on
Mar 23, 2000
Bought by
Phillips Bobby E
Create a Home Valuation Report for This Property
The Home Valuation Report is an in-depth analysis detailing your home's value as well as a comparison with similar homes in the area
Home Values in the Area
Average Home Value in this Area
Purchase History
| Date | Buyer | Sale Price | Title Company |
|---|---|---|---|
| Eason Artis Carl | $152,000 | -- | |
| Carver Allan | $147,000 | -- | |
| Morris Gary L | $134,300 | -- | |
| Hunter International | $21,000 | -- | |
| Phillips Bobby Dev I | -- | -- | |
| Phillips Bobby E | -- | -- |
Source: Public Records
Mortgage History
| Date | Status | Borrower | Loan Amount |
|---|---|---|---|
| Open | Eason Artis Carl | $157,016 |
Source: Public Records
Tax History Compared to Growth
Tax History
| Year | Tax Paid | Tax Assessment Tax Assessment Total Assessment is a certain percentage of the fair market value that is determined by local assessors to be the total taxable value of land and additions on the property. | Land | Improvement |
|---|---|---|---|---|
| 2024 | $382 | $110,338 | $12,000 | $98,338 |
| 2023 | $382 | $101,302 | $12,000 | $89,302 |
| 2022 | $455 | $87,389 | $12,000 | $75,389 |
| 2021 | $459 | $75,487 | $11,000 | $64,487 |
| 2020 | $461 | $68,064 | $11,000 | $57,064 |
| 2019 | $1,573 | $62,771 | $11,000 | $51,771 |
| 2018 | $1,466 | $55,826 | $11,000 | $44,826 |
| 2017 | $1,309 | $55,826 | $11,000 | $44,826 |
| 2016 | $1,310 | $55,826 | $11,000 | $44,826 |
| 2015 | $1,262 | $49,124 | $8,400 | $40,724 |
| 2014 | $1,267 | $49,124 | $8,400 | $40,724 |
Source: Public Records
Map
Nearby Homes
- 204 Emily Cir
- 212 Emily Cir
- 147 Amidon Dr
- 147 Amidon Dr Unit 28
- 0 Amidon Dr Unit 7203047
- 0 Amidon Dr Unit 8328999
- 0 Amidon Dr Unit 8304181
- 0 Amidon Dr Unit 7585599
- 0 Amidon Dr Unit 7217385
- 0 Amidon Dr Unit 7211905
- 0 Amidon Dr Unit 7047018
- 0 Amidon Dr Unit 8003363
- 0 Amidon Dr Unit 8326839
- 0 Amidon Dr Unit 3279039
- 0 Amidon Dr Unit 7441236
- 0 Amidon Dr
- 203 Emily Cir
- 216 Emily Cir
- 211 Emily Cir
- 207 Emily Cir