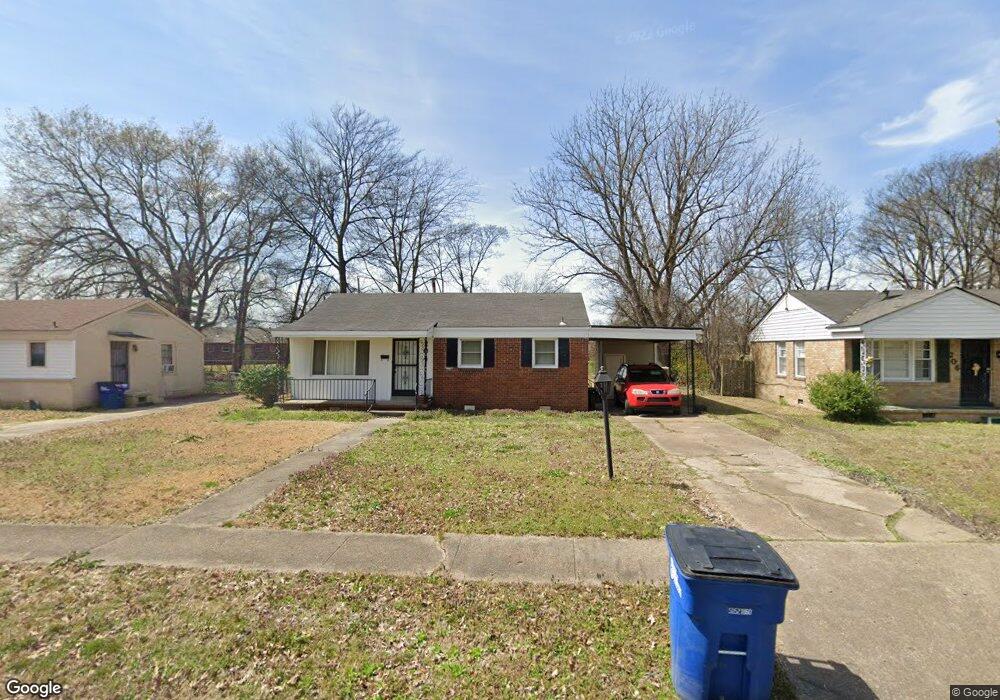
204 Fallis St West Memphis, AR 72301
Estimated Value: $49,000 - $119,000
2
Beds
1
Bath
851
Sq Ft
$91/Sq Ft
Est. Value
About This Home
This home is located at 204 Fallis St, West Memphis, AR 72301 and is currently estimated at $77,439, approximately $90 per square foot. 204 Fallis St is a home located in Crittenden County with nearby schools including Maddux Elementary School, Wonder Junior High School, and The Academies of West Memphis Charter School.
Ownership History
Date
Name
Owned For
Owner Type
Purchase Details
Closed on
Aug 15, 2022
Sold by
Watson Juanita
Bought by
Williams Kwame
Current Estimated Value
Purchase Details
Closed on
May 21, 2021
Sold by
Clays Construction & Rentals Llc
Bought by
Watson Juanita
Purchase Details
Closed on
Sep 10, 2009
Sold by
Federal Home Loan Mortgage Corporation
Bought by
Clay Derrick
Purchase Details
Closed on
Feb 25, 2009
Sold by
Wharton Ruby R
Bought by
Simpson Larry
Purchase Details
Closed on
Jan 26, 2009
Sold by
Us Bank
Bought by
Secretary Of Housing And Urban Devlopmen
Purchase Details
Closed on
Mar 7, 2007
Sold by
Simpson Larry
Bought by
Carr Valarie
Purchase Details
Closed on
May 30, 2006
Sold by
Arvest Mortgage Company
Bought by
Secretary Of Housing And Urban Devlopmen
Purchase Details
Closed on
Sep 20, 2005
Sold by
Not Provided
Bought by
Carr Valarie
Create a Home Valuation Report for This Property
The Home Valuation Report is an in-depth analysis detailing your home's value as well as a comparison with similar homes in the area
Purchase History
| Date | Buyer | Sale Price | Title Company |
|---|---|---|---|
| Williams Kwame | -- | -- | |
| Watson Juanita | $15,000 | Stewart Title | |
| Clay Derrick | -- | -- | |
| Simpson Larry | -- | -- | |
| Secretary Of Housing And Urban Devlopmen | -- | -- | |
| Carr Valarie | -- | -- | |
| Simpson Larry | -- | -- | |
| Secretary Of Housing And Urban Devlopmen | -- | -- | |
| Carr Valarie | $23,242 | -- |
Source: Public Records
Tax History
| Year | Tax Paid | Tax Assessment Tax Assessment Total Assessment is a certain percentage of the fair market value that is determined by local assessors to be the total taxable value of land and additions on the property. | Land | Improvement |
|---|---|---|---|---|
| 2025 | $199 | $10,188 | $1,100 | $9,088 |
| 2024 | $150 | $2,960 | $800 | $2,160 |
| 2023 | $150 | $2,960 | $800 | $2,160 |
| 2022 | $15 | $2,960 | $800 | $2,160 |
| 2021 | $149 | $2,960 | $800 | $2,160 |
| 2020 | $134 | $2,960 | $800 | $2,160 |
| 2019 | $198 | $5,250 | $1,760 | $3,490 |
| 2018 | $219 | $5,250 | $1,760 | $3,490 |
| 2017 | $219 | $5,250 | $1,760 | $3,490 |
| 2016 | $201 | $5,250 | $1,760 | $3,490 |
| 2015 | $221 | $5,250 | $1,760 | $3,490 |
| 2014 | $365 | $8,780 | $1,760 | $7,020 |
Source: Public Records
Map
Nearby Homes
- 210 Bettis St
- 156 Stuart Ave
- 400 N 32nd St
- 2706 Tyler Ave
- 316 Magnolia St
- 201 S 31st St
- 2407 Autumn Ave
- 2604 E Jackson Ave
- 334 S 21st St
- 300 S 20th St
- 1913 Sula Ln
- 1804 Scottwood St
- 1912 N Mcauley Dr
- 2804 E Tyler Ave
- 1805 Goodwin Ave
- 1502 S Mcauley Dr
- 709 Holiday Dr
- 519 N 14th St
- 522 S 16th St
- 629 S 13th St
- 202 Fallis St
- 206 Fallis St
- 2612 Thompson Ave
- 208 Fallis St
- 200 Fallis St
- 205 Fallis St
- 210 Fallis St
- 207 Fallis St
- 2700 Thompson Ave
- 209 Fallis St
- 2706 Thompson Ave
- 211 Fallis St
- 2617 Thompson Ave
- 2613 Thompson Ave
- 2623 Thompson Ave
- 2701 Thompson Ave
- 202 Bettis St
- 204 Bettis St
- 212 Fallis St
- 213 Fallis St
Your Personal Tour Guide
Ask me questions while you tour the home.