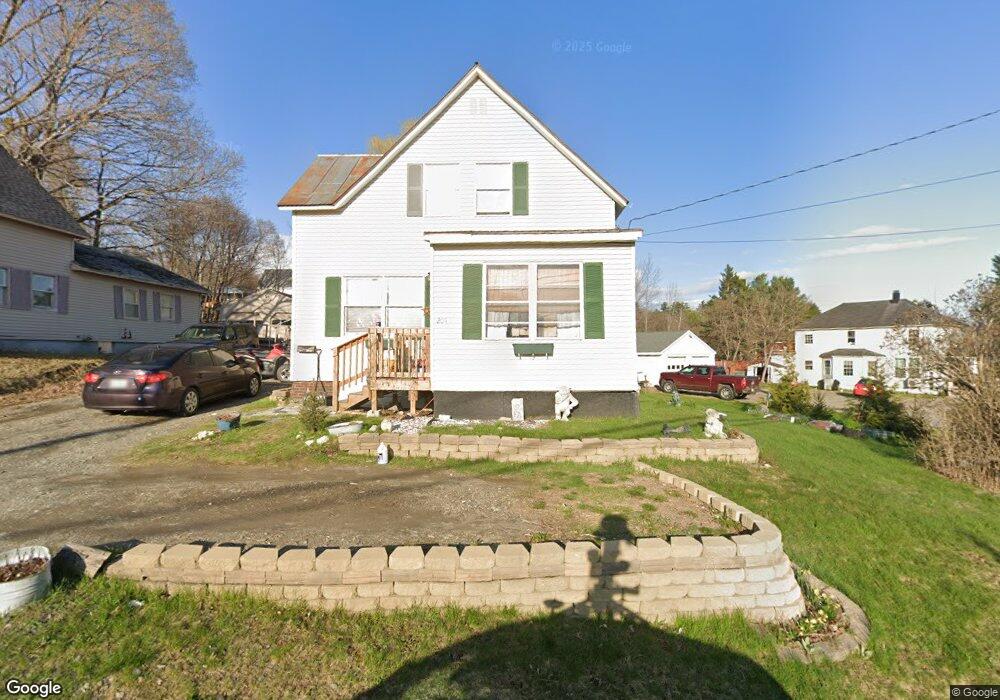
204 Free St Dexter, ME 04930
Estimated Value: $102,495 - $167,000
3
Beds
1
Bath
1,300
Sq Ft
$104/Sq Ft
Est. Value
About This Home
This home is located at 204 Free St, Dexter, ME 04930 and is currently estimated at $134,624, approximately $103 per square foot. 204 Free St is a home located in Penobscot County with nearby schools including Ridge View Community School, Dexter Regional High School, and Dexter Christian Academy.
Ownership History
Date
Name
Owned For
Owner Type
Purchase Details
Closed on
Sep 17, 2020
Sold by
Boy Gravis C
Bought by
Mckleroy Darlyn D
Current Estimated Value
Purchase Details
Closed on
Oct 14, 2016
Sold by
Ready Daniel A
Bought by
Boy Travis C
Home Financials for this Owner
Home Financials are based on the most recent Mortgage that was taken out on this home.
Original Mortgage
$32,000
Interest Rate
3.46%
Mortgage Type
New Conventional
Purchase Details
Closed on
May 19, 2014
Sold by
Provost Donna F Est
Bought by
Ready Daniel A
Purchase Details
Closed on
Jan 28, 2014
Sold by
Rush Ryan R
Bought by
Ready Daniel A and Provost Donna F
Purchase Details
Closed on
May 7, 2009
Sold by
Ready Daniel A and Ready James L
Bought by
Rush Ryan R
Home Financials for this Owner
Home Financials are based on the most recent Mortgage that was taken out on this home.
Original Mortgage
$41,000
Interest Rate
4.9%
Mortgage Type
Purchase Money Mortgage
Create a Home Valuation Report for This Property
The Home Valuation Report is an in-depth analysis detailing your home's value as well as a comparison with similar homes in the area
Home Values in the Area
Average Home Value in this Area
Purchase History
| Date | Buyer | Sale Price | Title Company |
|---|---|---|---|
| Mckleroy Darlyn D | -- | None Available | |
| Boy Travis C | -- | -- | |
| Ready Daniel A | -- | -- | |
| Ready Daniel A | -- | -- | |
| Rush Ryan R | -- | -- |
Source: Public Records
Mortgage History
| Date | Status | Borrower | Loan Amount |
|---|---|---|---|
| Previous Owner | Boy Travis C | $32,000 | |
| Previous Owner | Rush Ryan R | $41,000 |
Source: Public Records
Tax History
| Year | Tax Paid | Tax Assessment Tax Assessment Total Assessment is a certain percentage of the fair market value that is determined by local assessors to be the total taxable value of land and additions on the property. | Land | Improvement |
|---|---|---|---|---|
| 2024 | $882 | $45,000 | $8,900 | $36,100 |
| 2023 | $904 | $45,900 | $9,800 | $36,100 |
| 2022 | $900 | $45,000 | $8,900 | $36,100 |
| 2021 | $882 | $45,000 | $8,900 | $36,100 |
| 2020 | $882 | $45,000 | $8,900 | $36,100 |
| 2019 | $882 | $45,000 | $8,900 | $36,100 |
| 2018 | $5,919 | $45,000 | $8,900 | $36,100 |
| 2017 | $5,619 | $45,000 | $8,900 | $36,100 |
| 2016 | $837 | $45,000 | $8,900 | $36,100 |
| 2015 | $837 | $45,000 | $8,900 | $36,100 |
| 2014 | $1,473 | $83,200 | $8,900 | $74,300 |
Source: Public Records
Map
Nearby Homes
Your Personal Tour Guide
Ask me questions while you tour the home.